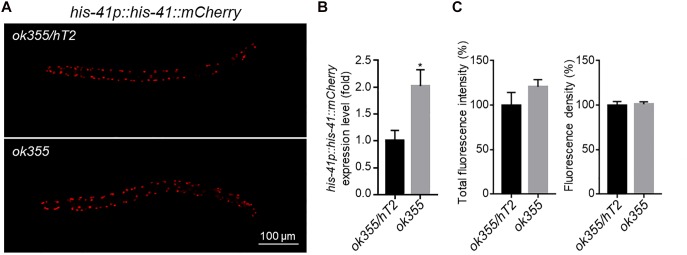
FIGURE 4.
his-41p::his-41::mCherry transgene expression. (A) Representative fluorescence pictures of HIS-41::mCherry fusion protein expression in an smn-1(ok355)/hT2 heterozygous or an smn-1(ok355) homozygous animal. (B) RT-qPCR quantification of his-41::mCherry expression levels. (C) Quantification of the total fluorescence intensity (left) and density (right) of mCherry. For mRNA expression, each dataset is the average of three biological replicates from one transgenic line. For mCherry intensity, each dataset is the average of 20 transgenic animals in two transgenic lines, with 10 animals from each line. Statistics: two-tailed unpaired Student’s t-test. ∗p < 0.05. Error bars: standard errors.

