Figure 5.
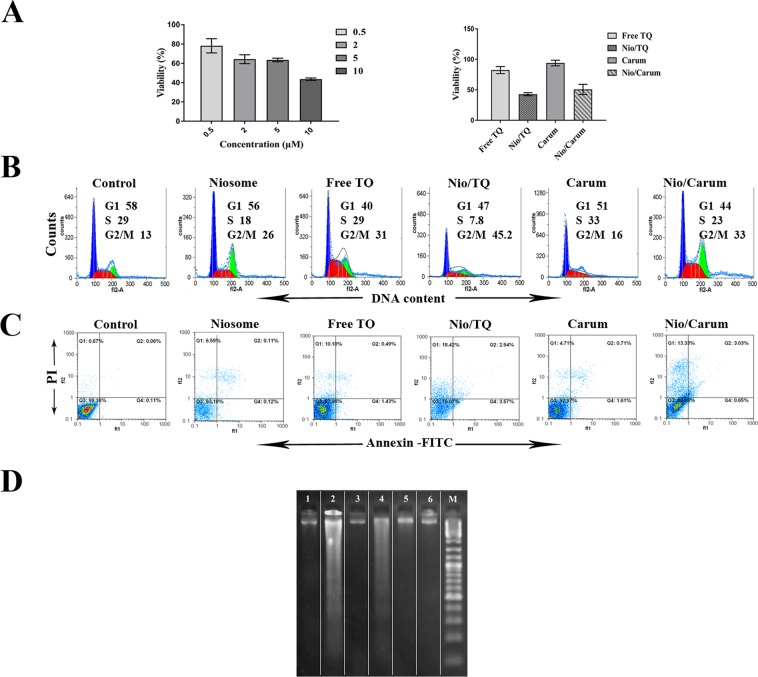
Cell viability assay of MCF-7 cells treated with 2 µM thymoquinone (TQ), TQ loaded noisomes (Nio/TQ), Carum extract (Carum) and Carum loaded niosomes (Nio/Carum(for 24 h. (A) MTT assay after treatment with different concentrations of blank noisome (0.5, 2, 5, and 10 µM) and MTT assay of free TQ, Nio/TQ, Carum and Nio/Carum. (B) Representative histogram plot of MCF-7 cells showing distribution in the different phases of the cell cycle after 24 h treatment, determined by flow cytometry after staining cells with PI. (C) Early, late apoptosis and necrosis of MCF-7 cells were analysed through flow cytometer after staining the cells with Annexin V-FITC and PI. (D) Detection of apoptotic DNA ladder in MCF-7 cell line by DNA fragmentation assay;(Lane M: Standard molecular size marker (1 Kb), Lane 1: free TQ, Lane 2: Nio/TQ, Lane 3: Carum, Lane 4: Nio/Carum, Lane 5: noisome and Lane 6: untreated cells The lanes are cropped from the same gel (a full image of the gel is provided in the Supplementary Information). Values were expressed as the mean of three different experiments ± SD.

