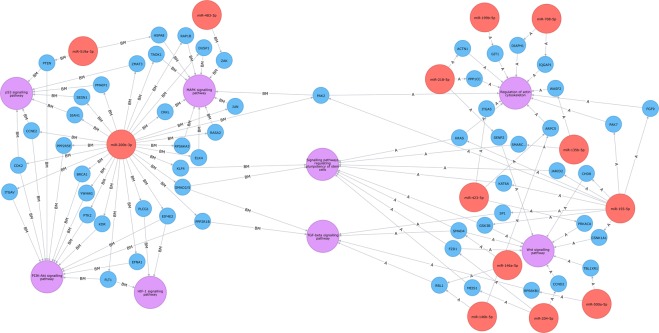
Figure 3.
Graphical visualization of miRNA-target interactions. Neo4J software graphical visualization of miRNA-target interactions, concerning the Profile BM (left) and Profile (right) A. Red circles represent miRNAs. Blue circles represent genes that interact with the miRs, experimentally supported in TarBase. Purple circles represent the relevant pathways, that include validated target genes. Both the Profile BM and Profile A share “TGF-beta Signalling Pathway” and “Signaling Pathways Regulating Pluripotency Of Stem Cells”.

