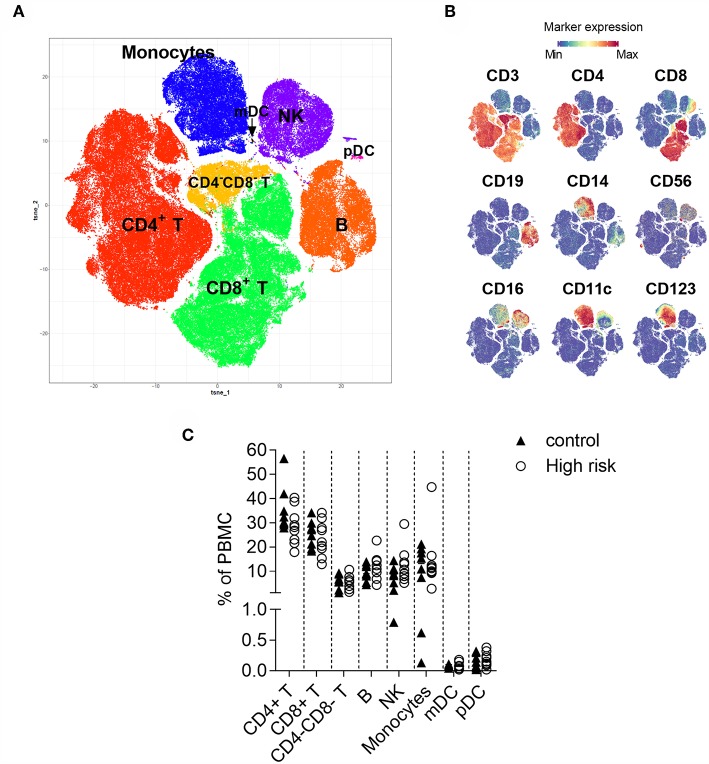
Figure 1.
t-Distributed Stochastic Neighbor Embedding (t-SNE) analysis of CD45+ cells. (A) Two-dimensional map where cells (dots) are plotted according to their expression of all markers. (B) Immune cell populations are annotated based on the intensity of expression of lineage antigens. CD4+ (CD3+CD4+), CD8+ (CD3+CD8+), CD4−CD8− (CD3+CD4−CD8−) T cells, B cells (CD19+), monocytes (CD14+), NK cells (lineage−, CD56+), mDC (lineage−CD11c+CD123−), pDC (lineage−, CD11c−CD123+). The arrow indicates the position of the mDC. (C) Percentage of CD4+ T, CD8+ T, CD4−CD8− T, B and NK cells, monocytes, and myeloid and plasmacytoid dendritic cells within peripheral mononuclear cells (PBMC) in individuals with high-risk for type 1 diabetes (n = 9, white circles) and controls (n = 9, black triangles). Dots represent individual samples. Differences between groups were tested using Mann-Whitney U-test. No significant differences were found.

