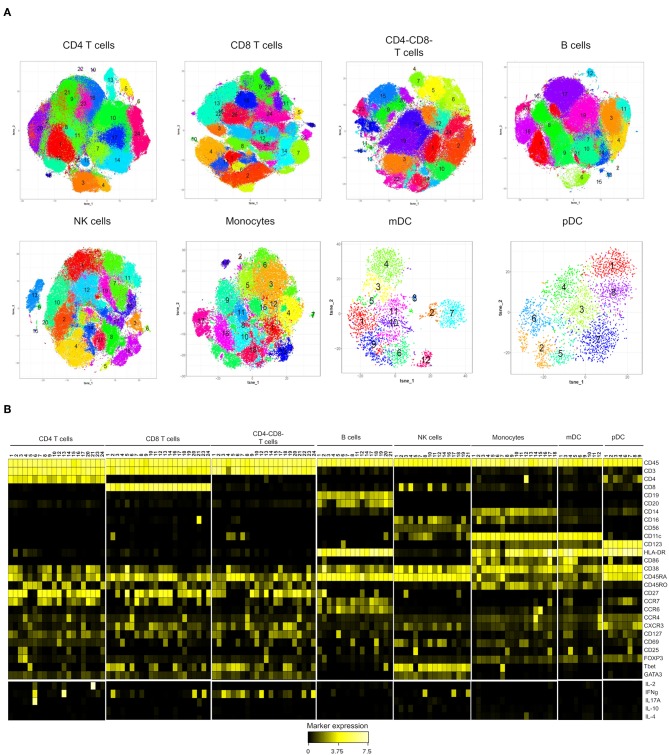
Figure 2.
Subset identification within the major immune populations in peripheral mononuclear cells from high-risk (n = 9) and control individuals (n = 9). (A) Phenotypically distinct subsets were identified with t-SNE combined with Phenograph analysis of each lineage population (colored areas) (B) Heatmap showing median expression of the markers expressed by the cell subsets identified in (A). Subsets of CD4+ (11,18,19,22,25), CD8+ (15, 20, and 22), CD4-CD8- (11,16), B (9,10,13,15,16) NK (6,9,13,15,20), mDC (2,7,8) and pDC (5) were excluded from the heatmap. Cytokine (IL-2, IFNγ, IL-17A, IL-10, and IL-4) expression is shown as subtraction of the expression on un-stimulated PBMC from samples stimulated with PMA+ ionomycin. Values were transformed using arcsinh function in a cofactor of 5.

