Figure 4.
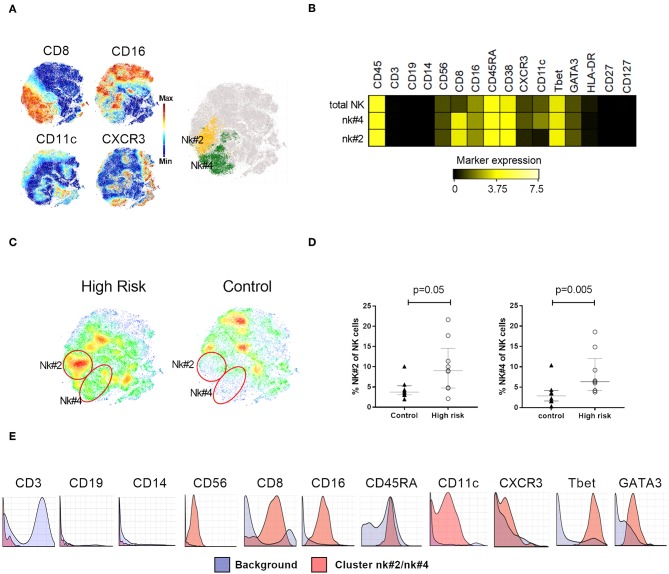
NK cell phenotyping. (A) Clustering analysis on NK cells expressing CD8, CD16, CD11c, and CXCR3 characterized two NK subsets, nk#2 (yellow) and nk#4 (green), highlighted on the t-SNE map (B) Median expression of relevant markers used for the identification of NK subsets nk#2 and t4#4. (C) t-SNE plots illustrating cellular density in individuals with high risk for type 1 diabetes and controls. (D) Percentage of nk#4 and nk#2 subsets within total NK cells in high-risk individuals (n = 9, white circles) and controls (n = 9, black triangles). (E) Citrus-generated histograms showing marker distribution in cluster nk#2/nk#4 (red) in relation to background expression (blue). Background was determined by all the cells that don not belong to the clusters significantly different between the groups, i.e., whole PBMC. Dots represent individual samples. Error bars show median ± interquartile range. Median expression values were transformed using arcsinh function in a cofactor of 5. p-values for differences between groups were determined using Mann-Whitney U-test. p < 0.05 was considered significant.

