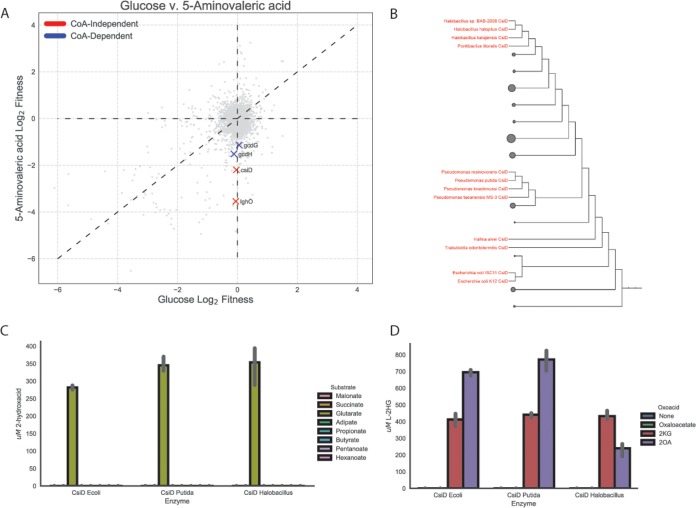
FIG 6.
Role of CsiD in P. putida lysine metabolism. (A) Plot of genome-wide fitness values of libraries grown on either 5AVA or glucose. CoA-dependent glutarate degradation genes are shown in red, while those known to be involved succinate producing metabolism are shown in blue. (B) Phylogenetic tree of bacterial CsiD homologs. Homologs used in in vitro assays are highlighted in red. (C) In vitro reactions of CsiD with different substrates using 2KG as a 2-oxoacid. Bars show the peak area of 2-hydroxyacid; error bars show 95% CI; n = 3. (D) In vitro reactions of CsiD homologs with different 2-oxoacids. Bars represent spectral counts of l-2HG. Error bars show 95% CI; n = 3.

