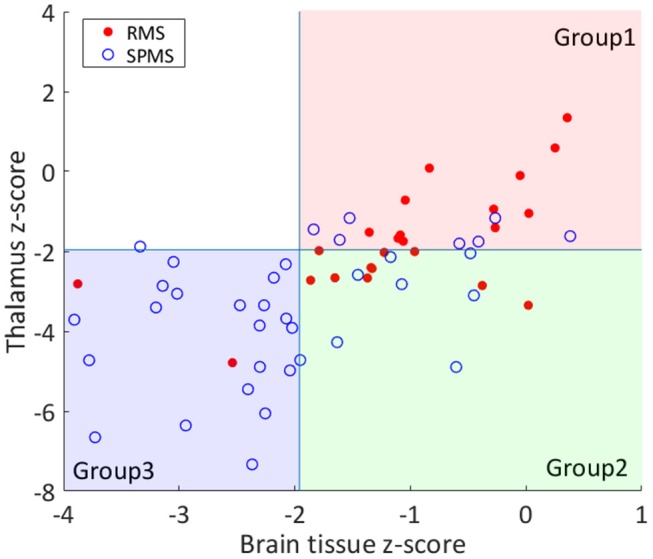
Figure 1.

Grouping of the patients based on thalamic and BP atrophy. The RMS and SPMS patients were divided into groups based on thalamus and brain parenchyma (BP) volume z-scores. The z-scores were computed by comparing individual brain volumes against healthy controls. A z-score cut-off of −1.96 was applied to separate atrophic from normal brain volumes for thalamus and whole BP. RMS patients are marked with filled red circles and SPMS patients are marked with blue rings. Most of the RMS patients fell into Group 1 (both normal BP and thalamus). Group 2 patients had thalamic atrophy without BP atrophy. Most of the SPMS patients had both BP and thalamic atrophy (Group 3). As shown, only 1 patient had BP atrophy without thalamic atrophy (upper left quadrant).
