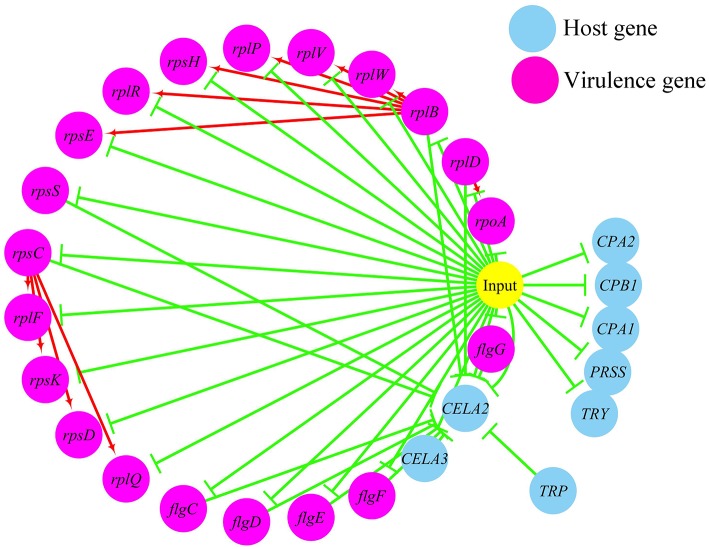
Figure 6.
The predicted regulation network between the virulence genes and host protein metabolism related genes. For the predicted regulation network, the yellow circle represents the occur of infection; each blue circle represents an input host immune response related genes; each purple circle represents an input virulence gene; each red line represents a positive correlation; and each green line represents a negative correlation.

