
Figure 2.
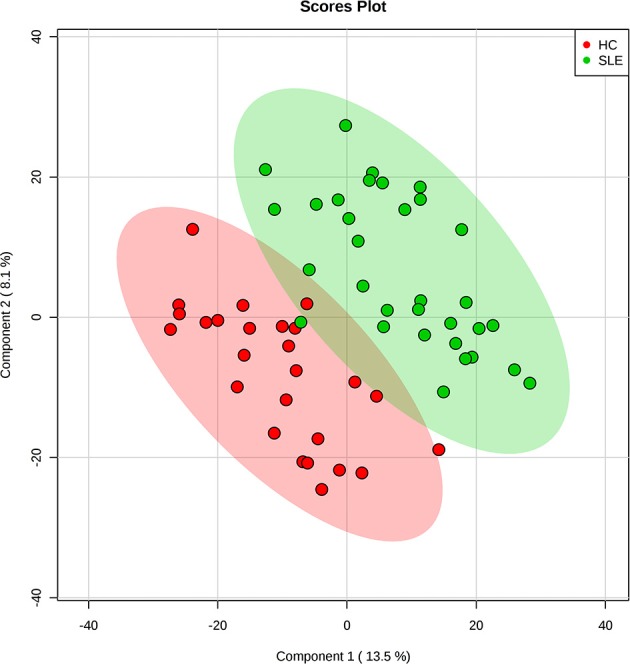
Partial least squares discriminant analysis (PLS-DA) of fecal metabolomics data from SLE patients and healthy controls. Fecal metabolites distinguished SLE patients from healthy controls. The green dots represented SLE patients and the red dots represented healthy controls in the two-dimensional PLS-DA score plots.