Fig. 4.
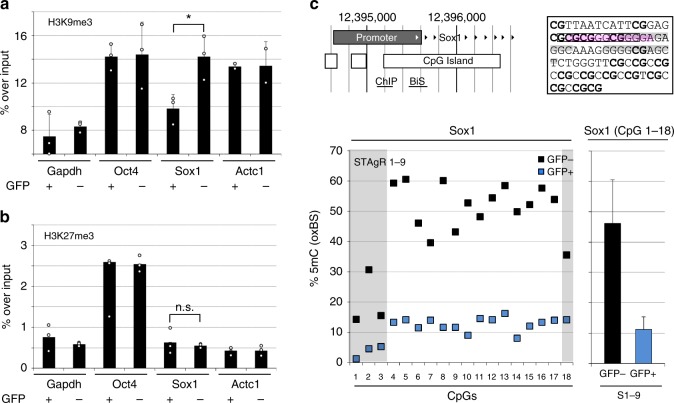
Heterogeneity of chromatin marks correlates to unresponsiveness to trans-activation. a Levels of H3K9 trimethylation on the Sox1 promoter differ significantly. Sox1GFP-positive and -negative samples were sorted to perform ChIP for H3K9me3. Gapdh, Oct4, and Actc1 are included as controls. Levels of K9 trimethylation were significantly higher in the Sox1GFP-negative population compared to the GFP-positive population. Data shown as mean and standard error of the mean of n = 3 biological replicates, performed on different days in different clonal lines, *p < 0.05 in two-sided Student’s t-test. b Levels of H3K27 trimethylation on the Sox1 promoter are similar. Sox1GFP-positive and -negative samples were sorted to perform ChIP for H3K27me3. Gapdh, Oct4, and Actc1 are included as controls. Levels of K27 trimethylation are not significantly different between the Sox1GFP-negative and-positive populations. Data shown as the mean and standard error of the mean of n = 3 technical replicates; n.s., not significant in two-sided Student’s t-test. c Sox1GFP-positive NPCs exhibit lower DNA methylation at the Sox1 promoter. (Top left) Structure of the Sox1 promoter, locations of ChIP qPCR and BS and OxBS amplicons are shown. (Top right) Sequence of the oxBS and BS analyzed sequence in the Sox1 promoter. CpGs are marked in bold. Predicted binding sites of YY1 (marked in grey) and Sp1/Sp3 (marked in pink) as well as E2F-1 (boxed) are indicated. (Below). Sox1GFP-positive and -negative cells were sorted to perform oxidative bisulfite sequencing. This revealed elevated DNA methylation levels in non-responsive cells on the Sox1 promoter (data depict the mean and standard error of the mean of NGS reads of at least n = 1000 individual sequences generated from two individual biological replicates generated and analyzed on separate days)

