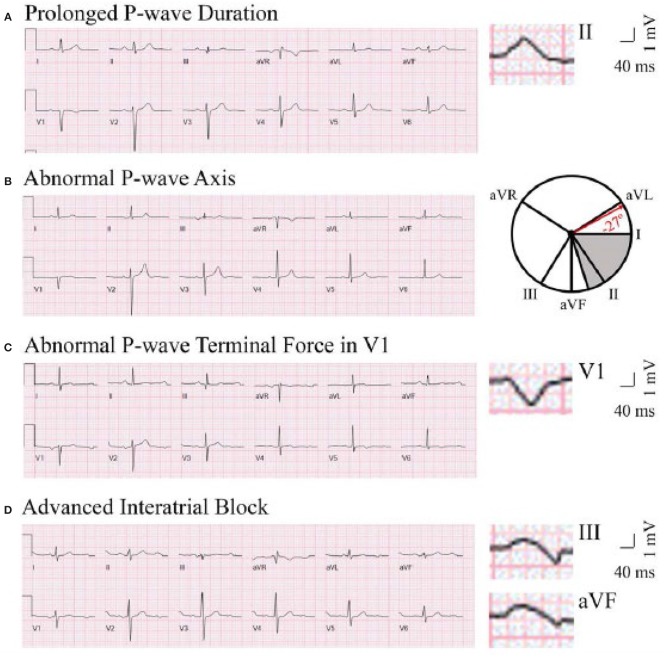
Figure 1.
Representative ECG tracings of abnormal P-wave indices. A through (D), Prolonged P-wave duration (A), abnormal P-wave axis (B), abnormal P-wave terminal force in V1 (C), and advanced interatrial block (D). (A) The maximal P-wave duration is seen in lead II (136 ms). (B) The gray area on the hexaxial reference system (lead I 0°, lead II 60°, aVF 90°, aVR −150°, aVL −30°) represents normal P-wave axis (0–75°). The P-wave axis on B is −27°. (C) The P-wave terminal force is −9,632 μV*ms (amplitude −112 μV, duration 86 ms). (D) The maximal P-wave duration is seen in lead III (136 ms). Biphasic P-waves can be seen in III and aVF. This figure has been republished from Maheshwari et al. (30). Chen and Soliman are allowed to republish this figure, per American Heart Association Journal Policy.

