Fig. 2.
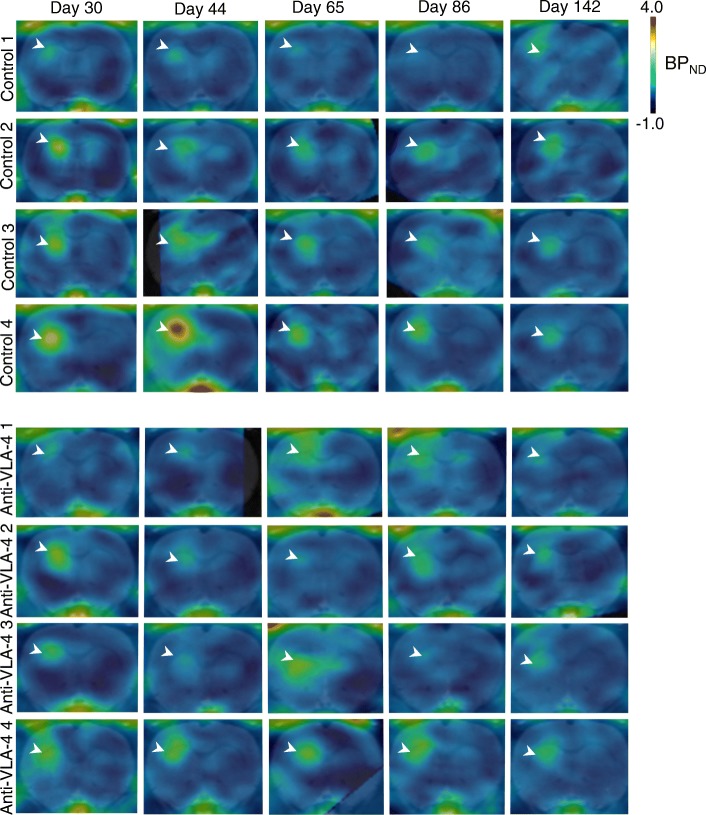
Time course of fDTH-EAE in PET imaging of rat brains. Representative coronal images of the BPND maps modelled with simplified reference tissue modelling and overlaid on a Schiffer MRI template. The control animals (n = 4) are shown in the top panels. The anti-VLA-4 mAb treated animals (n = 4) are shown on day 30 (when treatment was started), day 44, day 65 (at which time the treatment had been stopped for 4 days), day 86 and day 142. White arrow-heads point at the lesion. BCG Bacille Calmette-Guérin, BPND non-displaceable binding potential, fDTH focal delayed-type hypersensitivity, EAE experimental autoimmune encephalomyelitis, mAb monoclonal antibody, MRI magnetic resonance imaging, PET positron emission tomography

