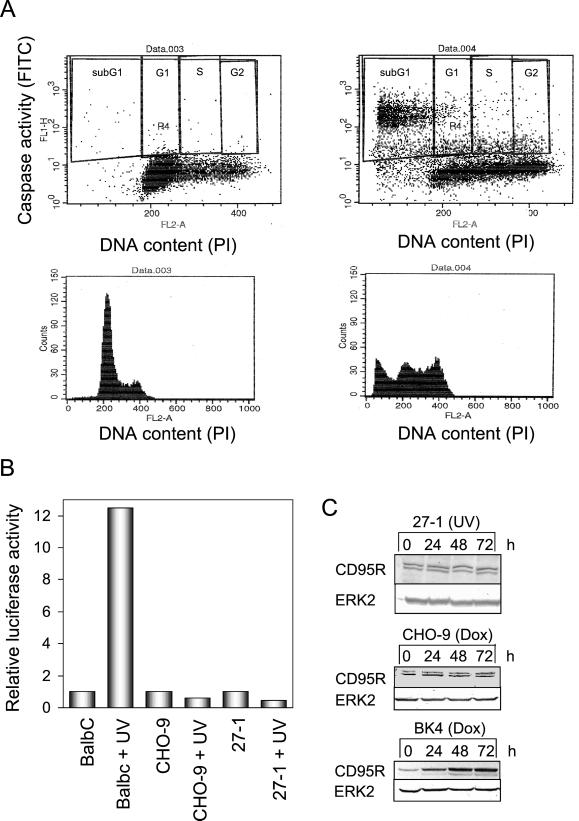
Figure 6.
Cell cycle-specific activation of caspases and p53 activity in UV-C–irradiated 27-1 cells. (A) Flow cytometric dual color staining for DNA content (PI) and caspase activity of untreated (top, left) and UV-C–treated (10 J/m2; top, right) 27-1 cells. The bottom panels show quantitative cell cycle distributions 36 h after treatment. (B) Determination of p53-regulated mdm2 promoter activity after transient transfection of the construct followed by UV-C irradiation (15 J/m2). Cells were harvested 12 h after treatment of BalbC, CHO-9, and 27-1 cells and analyzed for luciferase activity. (C) Expression of CD95R after UV-C treatment (10 J/m2) of 27-1 cells and of doxorubicin-treated (0.5 μg/ml) CHO-9 and BK4 cells, as shown by Western blot analysis.

