Fig. 2.

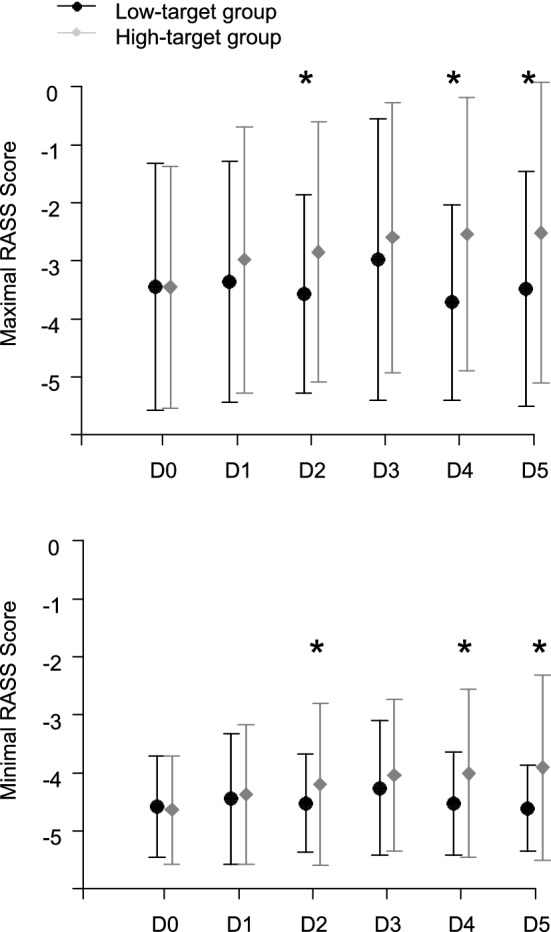
Comparison of daily mean minimal and maximal RASS values in the low-target group and the high-target group, during the 5 protocol-specified days. I bars represent standard deviation. *p < 0.05, considered as statistically significant

Comparison of daily mean minimal and maximal RASS values in the low-target group and the high-target group, during the 5 protocol-specified days. I bars represent standard deviation. *p < 0.05, considered as statistically significant