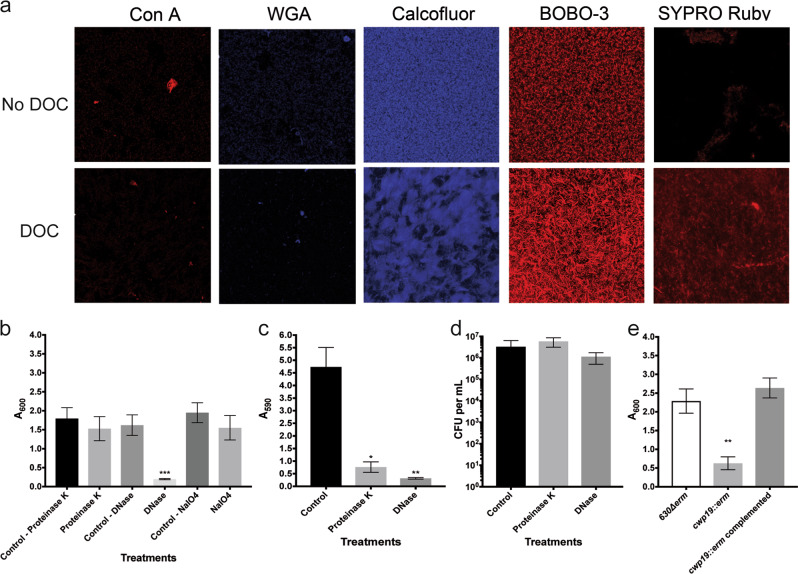
Fig. 3.
Analysis of the biofilm matrix composition in the absence and presence of DOC. a CLSM analysis of the biofilm stained with ConA-Cy3 (red/α-D-glucosyl or α-D-mannosyl residues), WGA-Cy3 (red/N-acetylglucosamine or sialic acid residues), calcofluor white (blue/β-1,3 or β-1,4 polysaccharides), BOBO-3 (red/eDNA), or Sypro Ruby (red/proteins). The CLSM observations were performed with unwashed biofilms. b Dispersion of 48 h biofilms with proteinase K, DNase I, and NaIO4. c Inhibition of biofilm formation by proteinase K and DNase I. d CFU of biofilms treated with proteinase K and DNase I. The viability assays were performed with unwashed biofilms. e Biofilm formation in BHISG with 240 µM DOC by the parental strain, the cwp19 inactivated strain and cwp19 complemented strain. Asterisks indicate statistical significance determined with a Kruskal–Wallis test followed by an uncorrected Dunn’s test (*p ≤ 0.05, **p ≤ 0.01 vs the control or 630∆erm.) Biofilm formation (b, c, e) was measured using a crystal violet assay that included two PBS washing before staining. Images are representative fields acquired from 3 different biological replicates. Each bar represents the mean of at least 5 biological replicates performed on different days. The error bars represent the standard error of the mean

