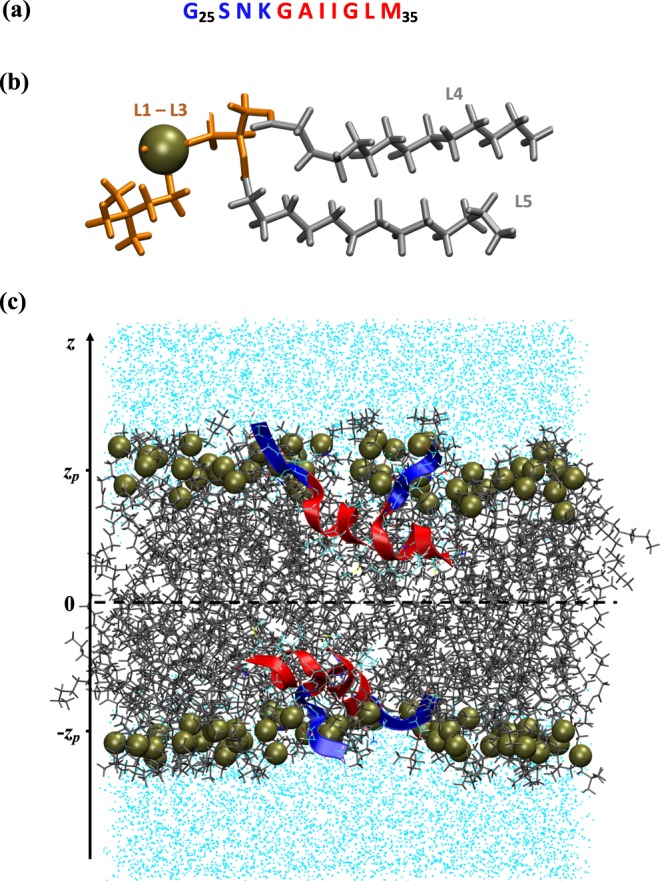
Figure 1.

Simulation model for investigating Aβ25-35 aggregation in the DMPC lipid bilayer. (a) The sequence of Aβ25-35 peptide. N-terminal R3 and C-terminal R4 regions are shown in blue and red, respectively. (b) DMPC lipid consists of five structural groups (see Methods). The polar lipid headgroups L1–L3 are shown in orange, and the fatty acid tails L4 and L5 constituting the hydrophobic core are shown in grey. Phosphorus atom is represented as a tan sphere. (c) A snapshot of the DMPC bilayer with two inserted Aβ25-35 dimers in an ID state (see Results). Lipids and water are in grey and cyan, respectively, and phosphorus atoms are displayed as tan spheres. R3 (blue) and R4 (red) regions in Aβ25-35 peptides are distinguished. The centers of mass of phosphorus atoms in each leaflet occur, on average, at ±ZP (zP = 17.37 Å).
