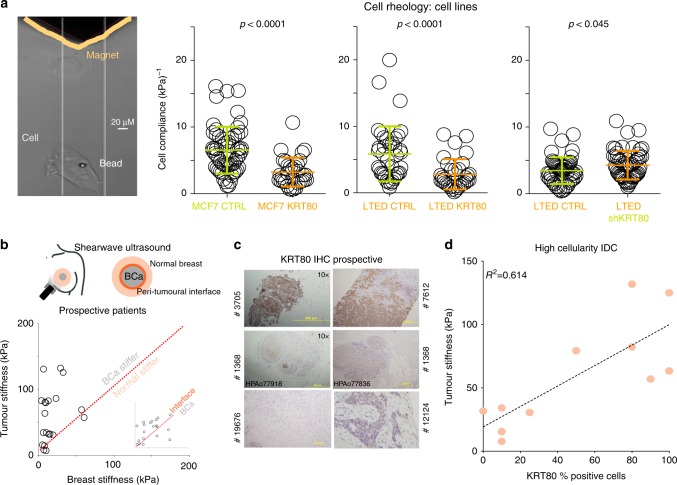
Fig. 4.
KRT80 levels are associated with changes in cell stiffness. a Magnetic tweezers (yellow) were used to measure the biomechanical properties of individual cells with or without KRT80 manipulation. Changes in cell compliance (deformation) were measured in KRT80 over-expressing cells for both parental MCF7 and AI-resistant LTED cells (left and middle graphs). Changes in cell compliance (deformation) were measured after stable KRT80 depletion in LTED cells (right graph). Significance was calculated with a student t- test and reported. b Shearwave Ultrasound measurements in prospectively recruited patients. Measures were collected at three independent location for each patient (see diagram). Plots show matched tissue stiffness for cancer vs. normal (large panel) and peri-tumoral interface vs. cancer (small inset). c KRT80 cells in diagnostic material from prospective patients assessed with ultrasound were counted using IHC. d Plots show matched tissue stiffness against the percentage of KRT80-positive cells for each individual patient. Simple linear regression was applied to calculate the correlation coefficient between these two values

