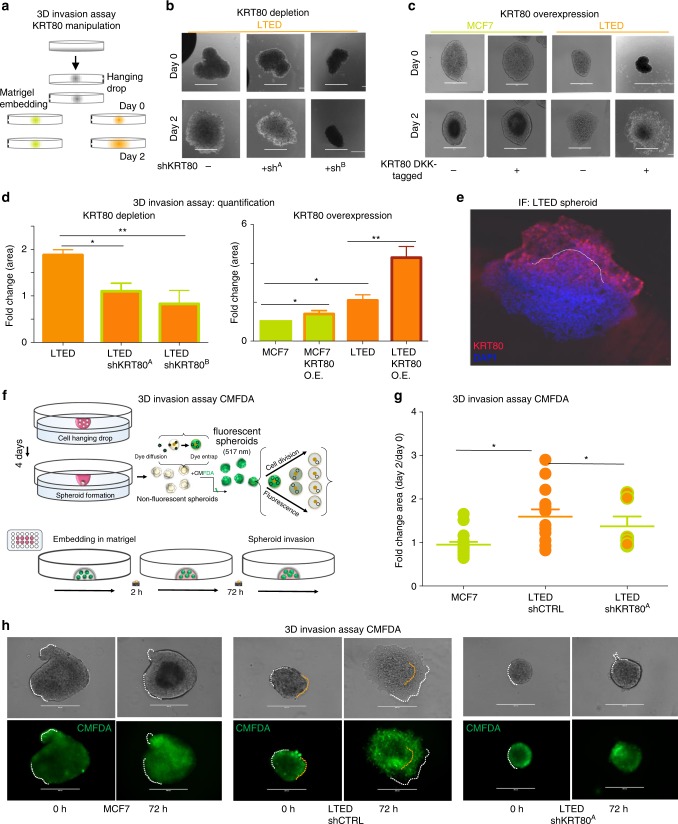
Fig. 5.
KRT80 directly promotes cell invasion. a Design of the 3D invasion assay. Organoids were derived from treatment naive (green; MCF7) or invasive AI resistant (orange; LTED) breast cancer cells. KRT80 expression was manipulated via ectopic overexpression or sh-mediated stable depletion. Organoids were embedded in Matrigel and monitored for 48 h. b Representative brightfield images of KRT80-manipulated organoids. Panels show results obtained in KRT80 depleted cells. c Representative brightfield images of KRT80-manipulated organoids. Panels show results obtained in KRT80 over-expressing cells (DKK-tagged KRT80). Small inset number represent normalized fold area changes of each represented experiment. Bars scale = 400 μm. d Quantification of the area fold change in organoids overexpressing KRT80 or KRT80 knock-down LTED cells in 3D invasion assay normalized to MCF7 (*p < 0.05, **p < 0.01, Student t test; n = 3 biological triplicates in which at least 4 organoids were measured). Data is presented as mean ± SD. e Confocal microscopy of matrigel embedded invasive AI resistant LTED organoids. f Replication dependent labeling of breast cancer spheroids. Cells were labeled with CMFDA that is converted to its membrane-impermeant fluorescent form by cytosolic esterase to entrap the dye. Active replication can dilute the dye until disappearance within 2–3 cell cycles. g Quantification of the area fold change in organoids treated with CMFDA. Lines represent mean and SD. Asterisks represent significance level p < 0.05 after Student t test. h Representative images of CMFDA tagged spheroids. Invasive borders are highlighted by dotted white lines. Representative original borders are highlighted by yellow dotted lines. Bars scale = 400 μm

