Fig. 6.
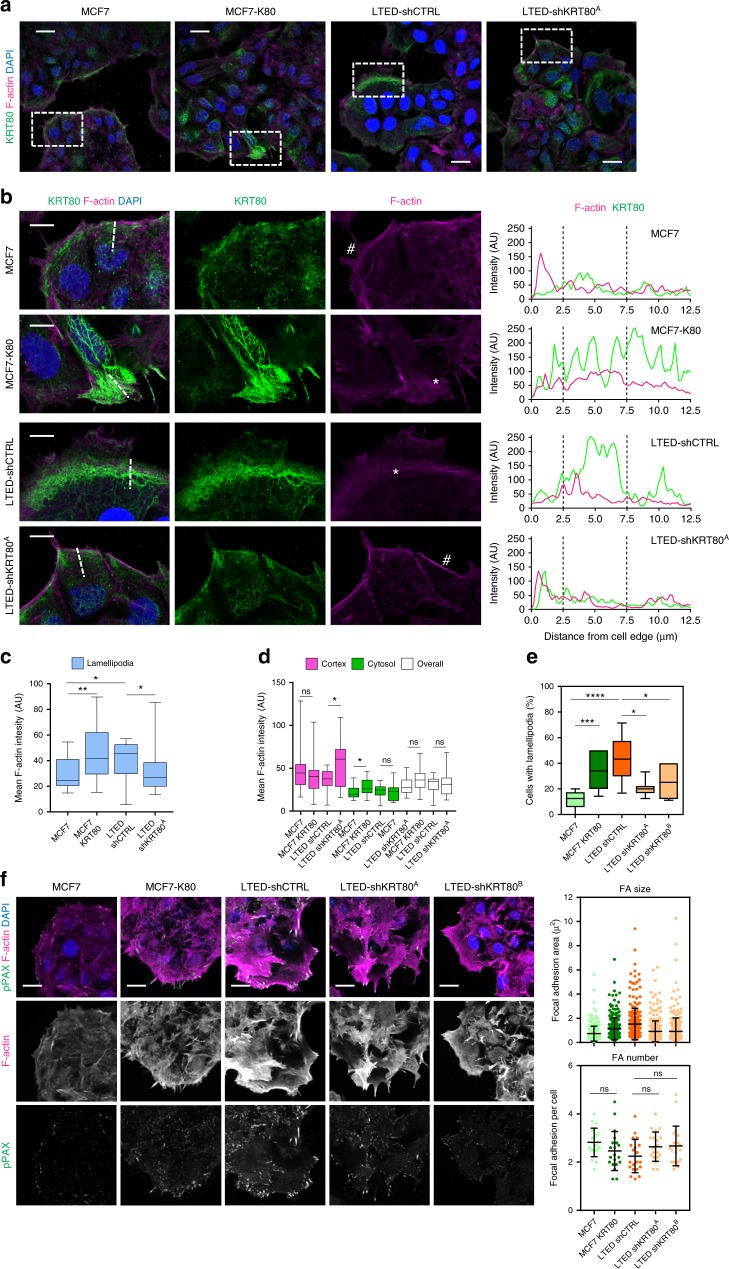
KRT80 induces invasion-associated cytoskeletal changes. a Representative confocal microscopy images showing F-actin (magenta), KRT80 (green) and DAPI (blue) staining of MCF7-control, MCF7-K80, LTED-control and LTED-sha cells. Scale bars represent 25 μm. b Zoom-up magnifications of areas indicated in a, showing F-actin (magenta), KRT80 (green) and DAPI (blue) staining in cells located at the border of clusters. Single channel images for F-actin and KRT80 are also shown. Scale bars, 10 μm. Asterisks indicate lamellipodia-like structures in MCF7-K80 and LTED cells, and hashtags indicate cortical actin areas in MCF7 and LTED-sha cells. Graphs on the right show line scan analysis for F-actin and KRT80 fluorescence across the leading edges of cells, as indicated in the broken line in the merged images. c, d Graphs show quantification of F-actin fluorescence intensity at lamellipodial regions (c) and at cell cortex, cytosol and overall (i.e., whole cell) (d) in MCF7-control, MCF7-K80, LTED-control and LTED-sha cells (n = 19, MCF7; n = 20, MCF7-K80; n = 14, LTED; n = 16, LTED-sha individual cells). e Graph shows quantification of percentage of cells with clear lamellipodia and membrane ruffles in MCF7-control, MCF7-K80, LTED-control, LTED-sha and LTED-shb cells (n = 8, MCF7; n = 12, MCF7-K80; n = 12, LTED; n = 7, LTED-sha; n = 6, LTED-shb fields of view). f Representative confocal microscopy images showing F-actin (magenta), pY118-Paxillin (green) and DAPI (blue) staining of MCF7-control, MCF7-K80, LTED-control, LTED-sha and LTED-shb cell. Scale bars, 25 μm. Graphs show quantification of individual leading-edge focal adhesion size (left) and number of adhesions per cell (right). Focal adhesion size (n = 269, MCF7; n = 251, MCF7-K80; n = 257, LTED; n = 331, LTED-sha; n = 276, LTED-shb). Focal adhesion number (n = 20, MCF7; n = 20, MCF7-K80; n = 20, LTED; n = 20, LTED-sha; n = 20, LTED-shb, individual cells). Statistical analyses were performed using one-way ANOVA with Tukey’s post-test. Floating bars and lines represent mean, inter-quantile distribution and SD. Asterisks represent significance at *p < 0.05, **p < 0.01 and ***p < 0.001 levels

