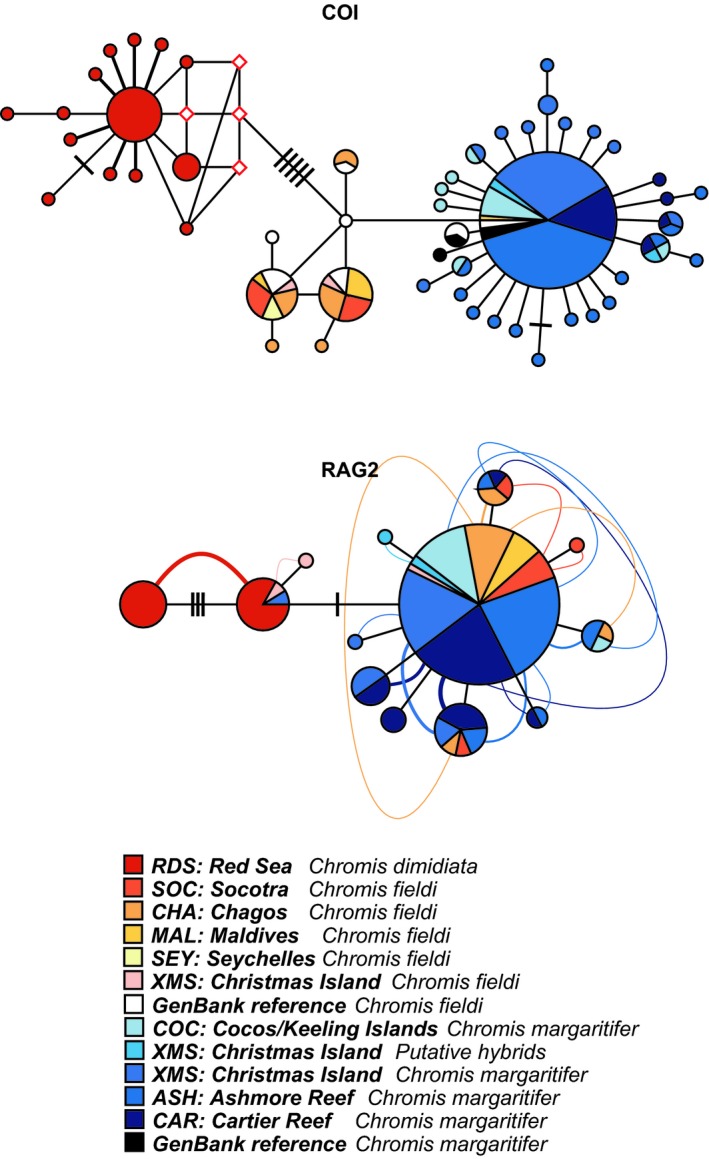
Figure 3.

Phylogenetic relationship among Chromis dimidiata, C. fieldi, and C. margaritifer haplotypes represented in a median‐joining network of the mitochondrial cytochrome C oxidase subunit 1 (COI) and a network‐based haploweb (Flot, Couloux, & Tillier, 2010) of the nuclear recombination‐activating gene 2 (RAG2). Each circle represents a unique haplotype and circle sizes are proportional to its total frequency. The red rhombuses represent missing haplotypes. Each branch connecting different circles represents a single nucleotide change and black cross‐bars represent additional nucleotide changes. Curved lines connecting haplotypes indicate haplotypes occurring in heterozygous individuals. Colors denote sampled species and their geographical origin as indicated in the legend
