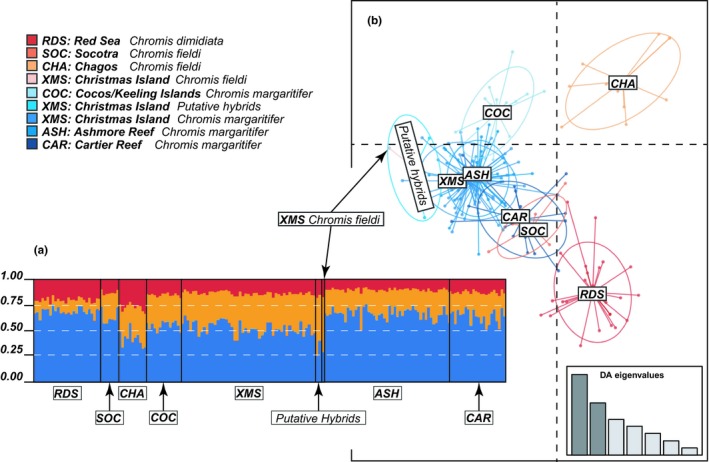
Figure 4.

STRUCTURE bar plot (a) and DAPC scatterplot (b) of Chromis dimidiata, C. fieldi, and C. margaritifer based on five neutral microsatellite markers. Posterior probability of assignment of Chromis samples to one of two (K = 2) genotype clusters is shown in the bar plot (a), generated using a Bayesian clustering analysis of microsatellite genotypes. Dots in the DAPC scatterplot (b) represent individual genotypes, and identity categories for genotypes of each individual are indicated in the legend. Genetic variations within each population/species are represented by 95% inertia ellipses. Eigenvalue plots show the amount of genetic information retained by each successive function
