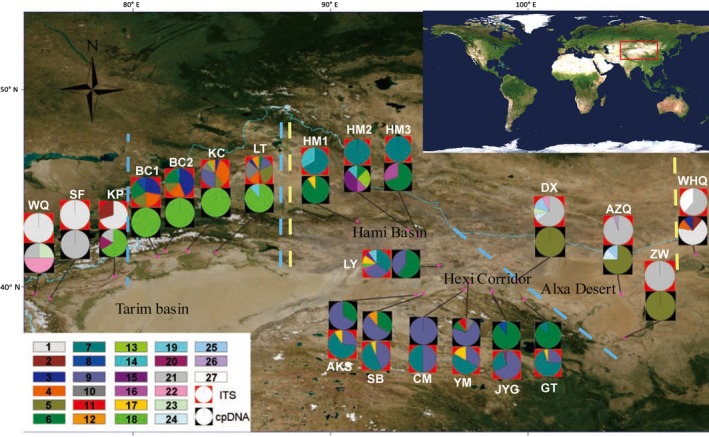
Figure 2.

Geographical distributions in northwestern China for cpDNA and ITS haplotypes found in G. przewalskii. Red boxes represent ITS haplotypes; black boxes represent cpDNA haplotypes; color bars represent haplotypes for both ITS and cpDNA. Pie charts show the different haplotypes and their proportions in each population. Blue dotted lines represent groups defined by the results of SAMOVA of ITS. Yellow dotted lines represent groups defined by the results of phylogenetic trees of cpDNA
