Figure 3.

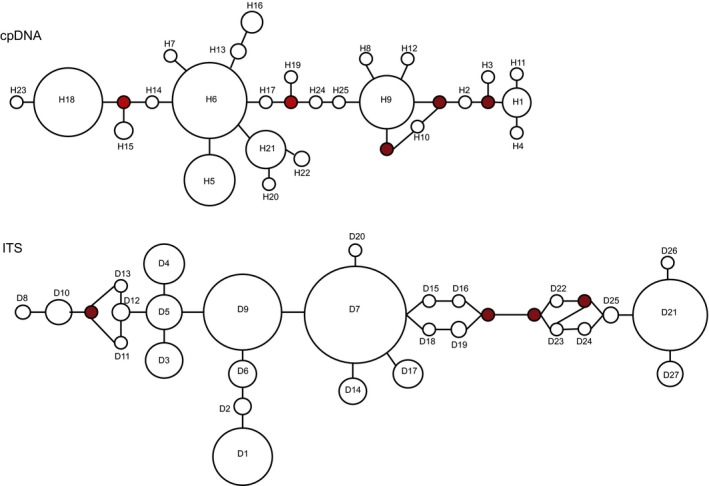
The haplotype networks in G. przewalskii. The red circle represents a hypothetical haplotype with another mutational step between real haplotypes. Circle sizes are proportional to haplotype frequencies in all samples

The haplotype networks in G. przewalskii. The red circle represents a hypothetical haplotype with another mutational step between real haplotypes. Circle sizes are proportional to haplotype frequencies in all samples