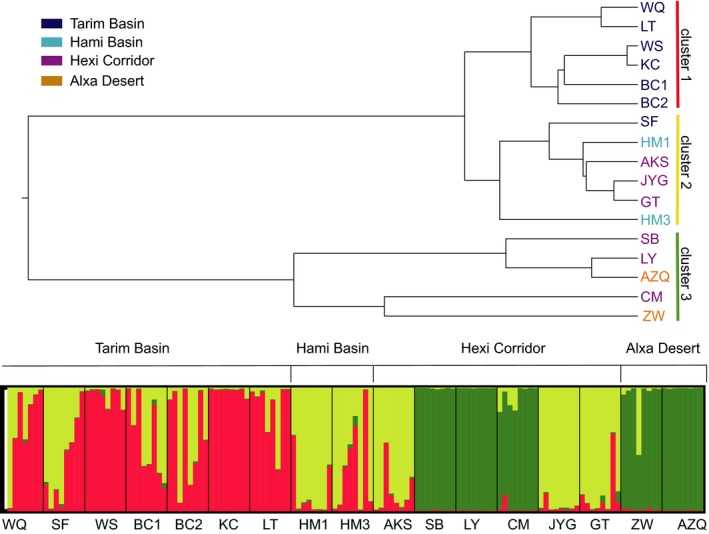
Figure 4.

Above, UPGMA dendrogram between the 17 populations of G. przewalskii based on genetic distance; below, spatial genetic structure of G. przewalskii using Bayesian assignment probability analysis. Colors of bar represent clustering of populations
