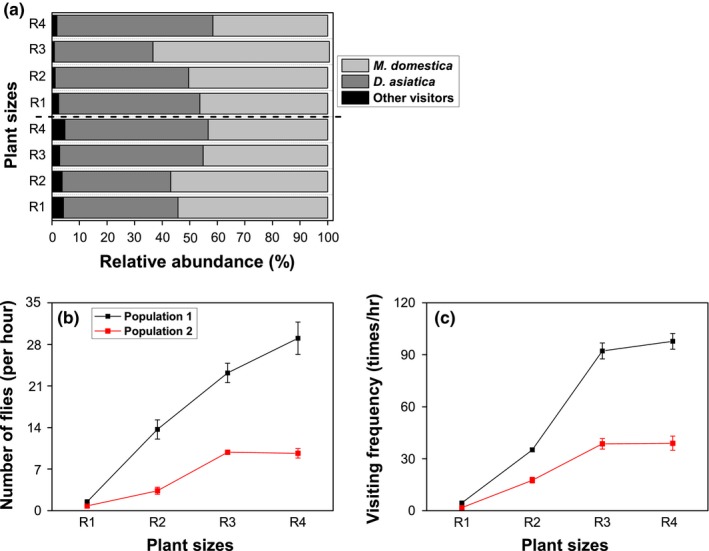
Figure 3.

Changes in relative abundance of visitors (a), fly abundance (b), and visiting frequency (c) in relation to different sizes of Thylacospermum caespitosum plants at two different altitudes. Error bars indicate the standard error of the means (n = 5)
