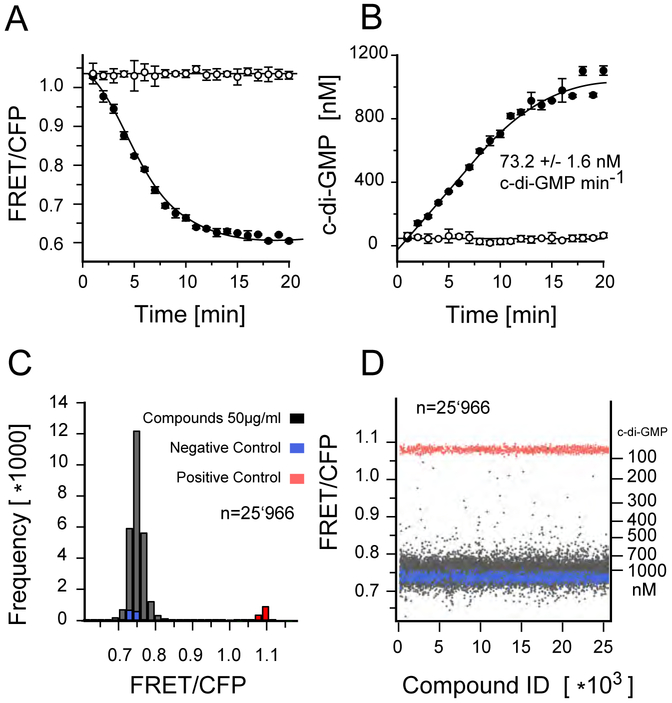
Figure 1:
FRET assay for c-di-GMP. A) Kinetics of fluorescence emission ration change (527/480nm) measured in a 384 well plate format. Affinity purified YcgR FRET biosensor was added in presence of 20 nM DgcA enzyme and 20μM GTP substrate (closed circles) or in absence of GTP (open circles). B) Corresponding increase in c-di-GMP concentration derived from the change in fluorescence emission ration (535/470nm). Above 800 nM c-di-GMP, allosteric product inhibition decreases DGC activity of DgcA. Each graph shows the average of three independent measurements. The reaction volume per well was 20 μl in a 384 well Corning low volume flat bottom plate. C) Histogram of the fluorescence emission ratio after 3 hours incubation of 20 nM DgcA with 20 μM GTP in presence of 50μg/ml compounds and 1% DMSO. Wells without GTP substrate added were used as positive controls (red), wells with exogenous c-di-GMP (5 μM) were used as negative controls (blue). D) Plate uniformity of the HT screening. For every well, background fluorescence signal of the compound has been measured prior addition of the FRET-biosensor. Compounds with auto fluorescence exceeding 7% of the FRET biosensor signal (535/470nm) were discarded.

