FIGURE 3.

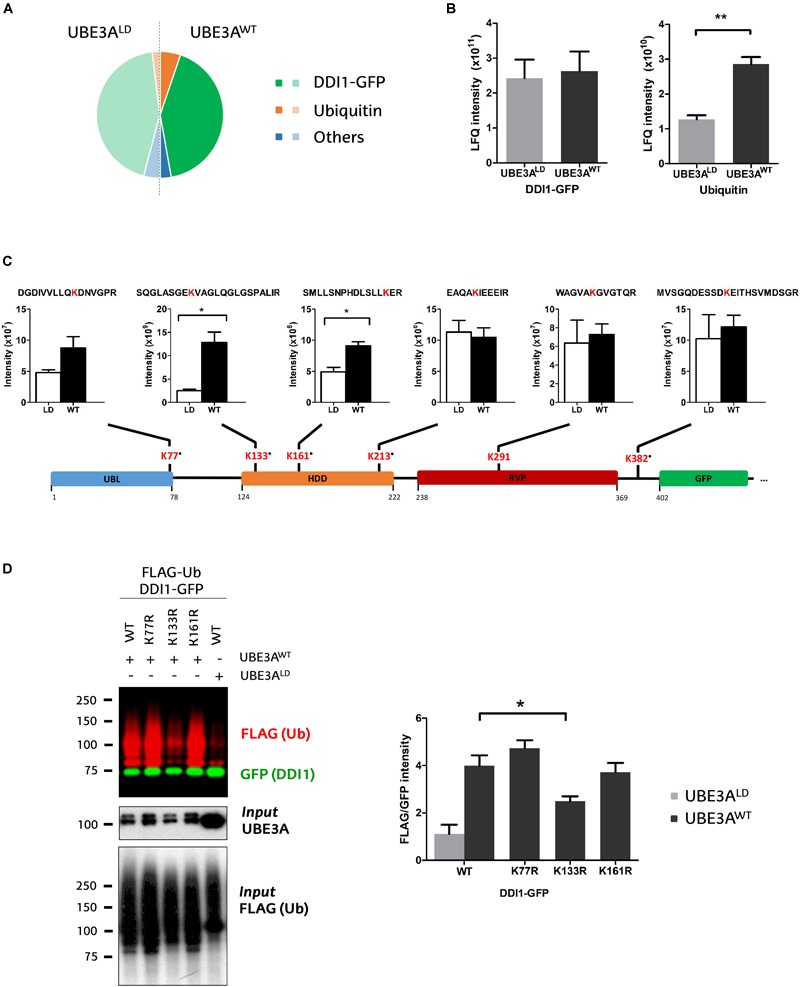
Identification and quantification of DDI1 ubiquitination sites. (A) Relative LFQ intensity of all the proteins detected by MS demonstrate that DDI1-GFP is the most abundant protein (green) in the GFP pull-down samples, followed by ubiquitin (orange). 287 more proteins (blue) were identified with marginal intensities. (B) Comparison of the intensities recorded for the two most abundant proteins in UBE3AWT and UBE3ALD reveal that whereas the levels of DDI1 detected are similar in both conditions, more ubiquitin was detected in the presence of UBE3AWT overexpression [t-test, ∗∗p-value < 0.05, (mean ± S.E.M., n = 3)]. (C) Schematic illustration of DDI1-GFP sequence, its domains (blue, UBL, ubiquitin-like domain; orange, HDD, helical-double domain; red, RVP, retroviral protease domain; green, GFP, GFP-tag of DDI1 protein) and the localization of the ubiquitination sites detected by mass spectrometry. Additionally, the diGly-modified peptides identified, within the ubiquitinated lysine marked in red, and the intensity values measured in each condition (WT, UBE3AWT and LD, UBE3ALD) are also indicated. “∙” indicates that the ubiquitination site is not reported in PhosphoSitePlus database. DiGly peptides encompassing K133 and K161 were statistically more abundant upon UBE3AWT overexpression [t-test, ∗p-value < 0.05, (mean ± S.E.M., n = 3)]. (D) UBE3A-dependent ubiquitination of three distinct DDI1-GFP mutants (K77R, K133R, or K161R) was monitored by western blot after isolating by GFP-pulldown. In red it is illustrated the ubiquitination pattern of DDI1, and in green the unmodified version of DDI1-GFP. Quantification and statistical analysis of the ubiquitination was performed with Image-J after normalizing FLAG intensities to GFP levels. Mutation on DDI1 lysine 133 significantly [one-way ANOVA, ∗p-value < 0.05, (mean ± S.E.M., n = 3)] abolishes its ubiquitination by UBE3AWT.
