
Fig. 3.
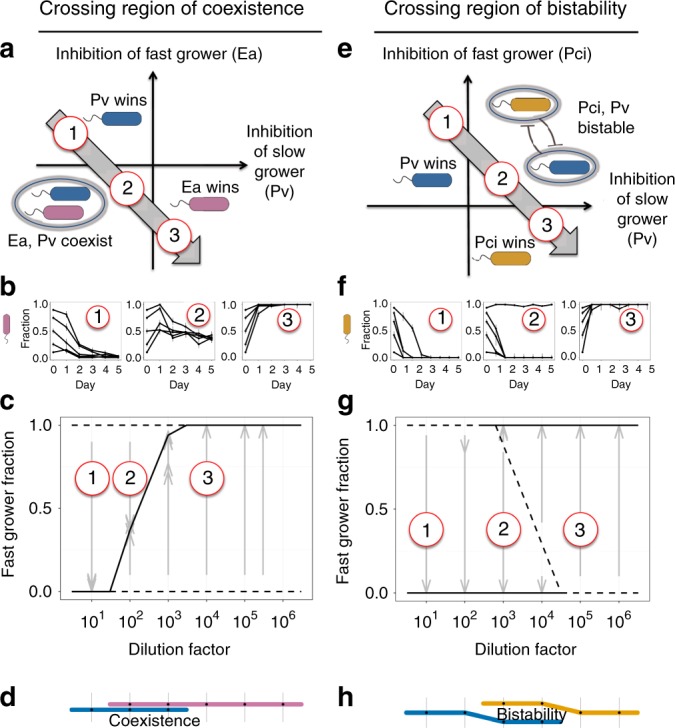
In pairwise coculture experiments, increasing dilution favors the faster grower. a Experimental results are shown from a coculture experiment with Pv (blue) and Ea (pink). b Left panel: Despite its slow growth rate, Pv excludes faster grower Ea at the lowest dilution factor. Middle panel: Increasing death rate causes the outcomes to traverse the coexistence region of the phase space. Right panel: As predicted, fast-growing Ea dominates at high dilution factor. Error bars are the SD of the beta distribution with Bayes' prior probability (see “Methods”). c An experimental bifurcation diagram shows stable points with a solid line and unstable points with a dashed line. The stable fraction of coexistence shifts in favor of the fast grower as dilution increases. Gray arrows show experimentally measured time trajectories, beginning at the starting fraction and ending at the final fraction. d A “subway map” denotes survival/extinction of a species at a particular dilution factor with presence/absence of the species color. e, f Pv outcompeted another fast grower Pci (yellow) at low dilution factors, but the pair became bistable instead of coexisting as dilution increased; the unstable fraction can be seen to shift in favor of the fast grower (g). h Two levels in the subway map show bistability. Source data are provided as a Source Data file