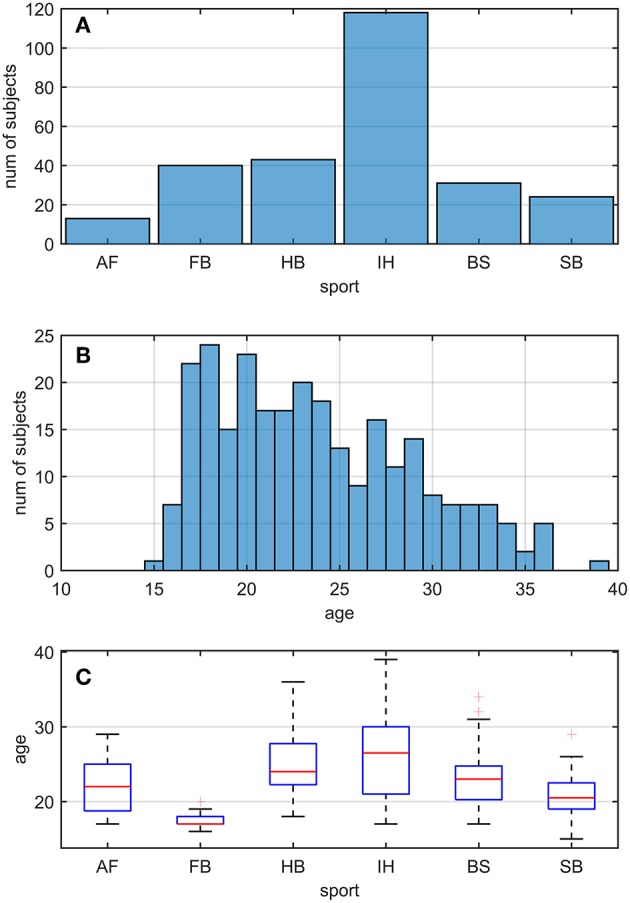
Figure 1.

Sport and age distributions of athletes. AF, American Football; FB, Football; HB, Handball; IH, Ice Hockey; BS, Bob and Skeleton; SB, Snowboard. (A) Number of athletes divided by sport. (B) Age distribution in the athletes. As visible, for each bin of one y.o. (expect for 15, 35, and 39), our data counted at least five athletes. (C) Boxplots of age distribution per sports. Despite sport groups did not cover overlapping age ranges, no relationship between and test performance was found (see Pooled Bin Approach: Between Sports Analysis in Results).
