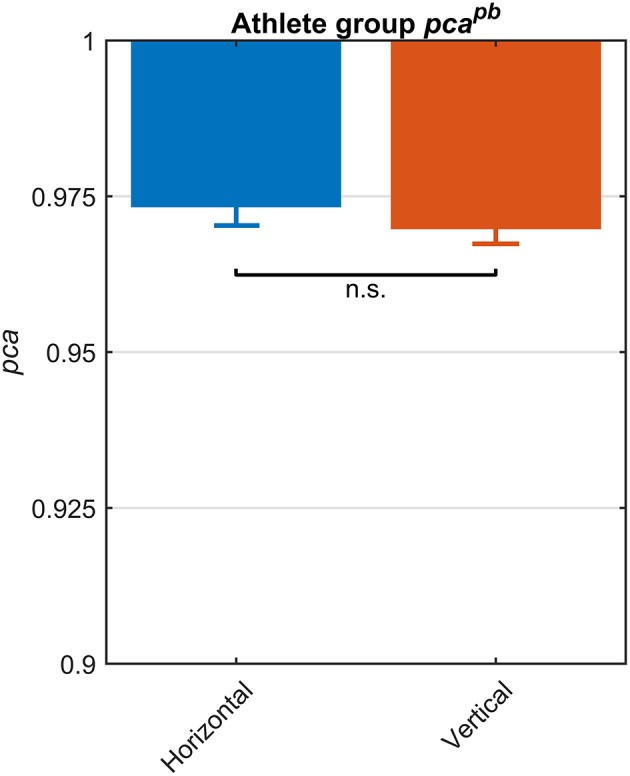
Figure 2.

Proportions of correct answers (pca) for each vestibular canal in the whole athlete group. Pca of impulses performed in the horizontal (blue) and vertical canals (red) were computed using the pooled approach (Equation 1) considering only head movements in the range of 2,001–6,000 deg/s2. Zeta distribution was used to estimate the lower bound of 95% confidence interval for pca, as the number of trials (i.e., performed head movements) was large enough (>>200). As visible, the fHIT performance was not significant influenced by canals (n.s.).
