
Figure 3.
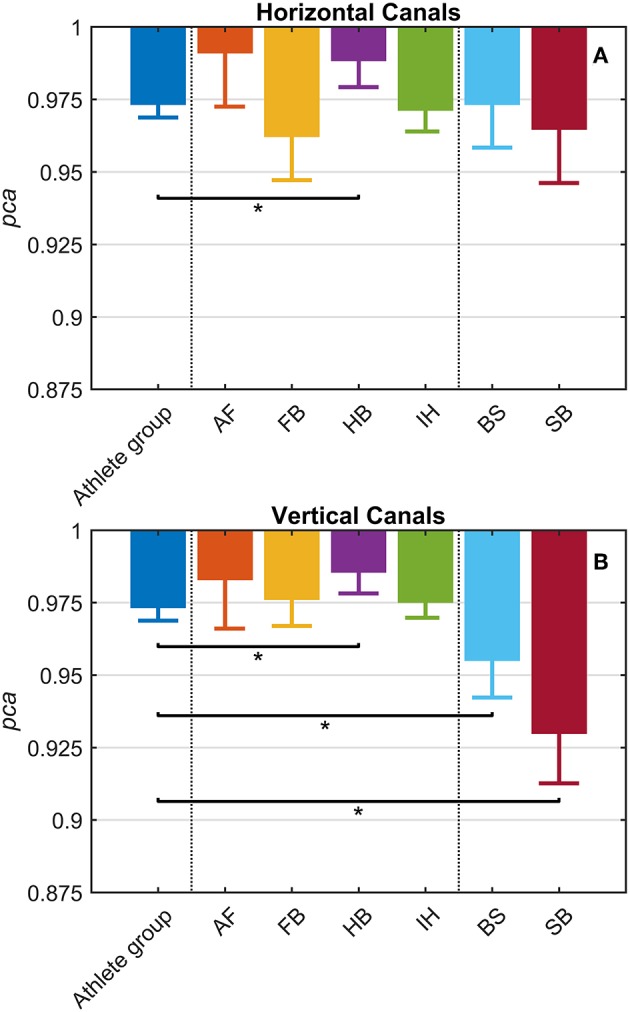
Proportion of correct answers (pca) in the whole athlete group and single sport. AF, American Football; FB, Football; HB, Handball; IH, Ice Hockey; BS, Bob and Skeleton; SB, Snowboard. For ease of visualization, the dashed vertical lines separate the whole athlete group from the ball sports (first vertical line) and the non-ball sport (second vertical line). All pca were computed using the pooled approach (Equation 1) considering only head movements in the range of 2,001–6,000 deg/s2. Zeta distribution was used to estimate the lower bound of 95% confidence interval (c.i.) for pca, as the number of trials (i.e., head movements) was large enough (>>200). The asterisk (*) represents the statistically significant comparisons (p-value < αbonf = 0.0083). (A) Horizontal canals. HB players (violet bar) showed a significant higher fHIT performance (pca >0.975) respect to the whole athlete group (dark blue bar). (B) Vertical canals. The fHIT performance in vertical canal was clearly lower pca in the non-ball sport players (i.e., BS and SB, respectively the light blue and dark red bar) respect to the whole athlete group. HB player, instead, confirmed the same finding for the horizontal canals, achieving a higher pca for impulses performed in the vertical canals as well.