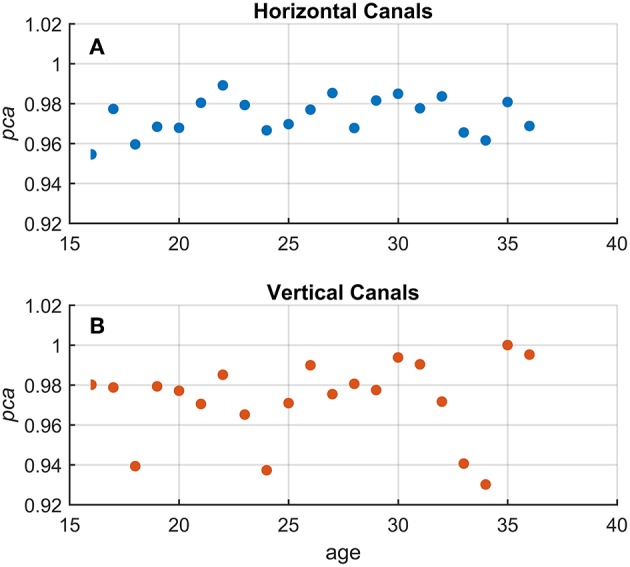
Figure 4.

Relationship between age and proportion of correct answers (pca) in the whole athlete group. Each point in the scatter plot represents a pca estimated in subgroups of athletes pooled by age (1-year-old bin). All pca were computed using the pooled approach (Equation 1) considering only head movements in the range of 2,001–6,000 deg/s2. As evident in the two scatter plots for fHIT performed in the horizontal (A and blue points) and vertical (B and red points), the point dispersal did not argument any potential correlation and/or interaction between the age and pca (i.e., test performance). The values of pca appear, indeed, randomly distributed regardless of age in a range between 1–0.95 and 1–0.92 for the horizontal and vertical canals, respectively.
