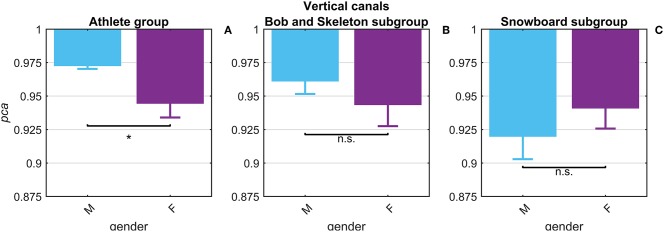
Figure 5.
Gender effect on proportion of correct answers (pca) for impulses in the plane of the vertical canals. Each bar represents the complement of pca (i.e., 1-pca) estimated in subgroups of athletes pooled by gender (female: violet bars; male: light blue bar). All pca were computed using the pooled approach (Equation 1) considering only head movements in the range of 2,001–6,000 deg/s2. Confidence intervals for pca were estimated as in Figure 3. The asterisk (*) represents the statistically significant comparisons (p-value < α = 0.05). Using the athlete group (A), the pca estimated in the subgroups of female athlete was significant lower than the pca of male athlete. The effect of gender on fHIT performance, however, was not present considering also the sport factor (B,C). The significant difference between genders, indeed, was induced by a non-uniform distribution of female athletes that were recruited only in the two sports (BS and SB) with the lowest pca for impulses performed in the vertical canals (see Table 2A).

