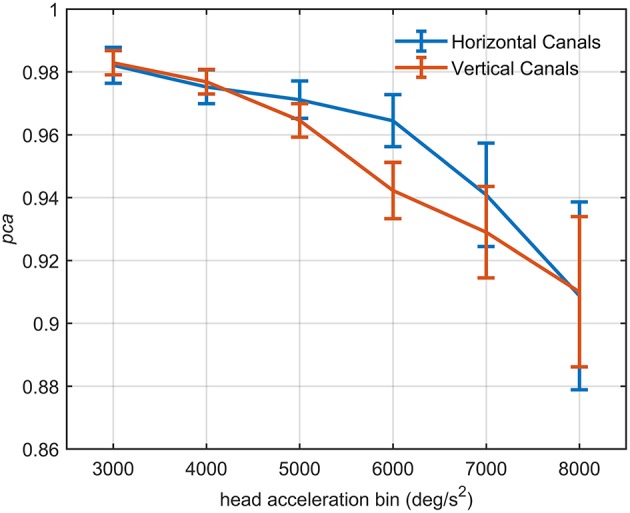
Figure 7.

Proportion of correct answers (pca) of the whole athlete group at different head acceleration bins. The error bars represent the pca and 95% confidence intervals estimated for bin of acceleration (3,000–8,000 deg/s2). Pca were computed using the single approach (Equation 1) for impulses performed in the plane of the horizontal (blue line) and vertical (red line) canals. Confidence intervals for pca were estimated as in Figure 3. The relationship between head acceleration and test performance appeared different between the two tested vestibular canals. The vertical canals showed, indeed, a significant decrease of the pca already from the 5,000 deg/s2 bin, while for the horizontal canal, the worsening in performance occur only after the 6,000 deg/s2 bin (Table 3).
