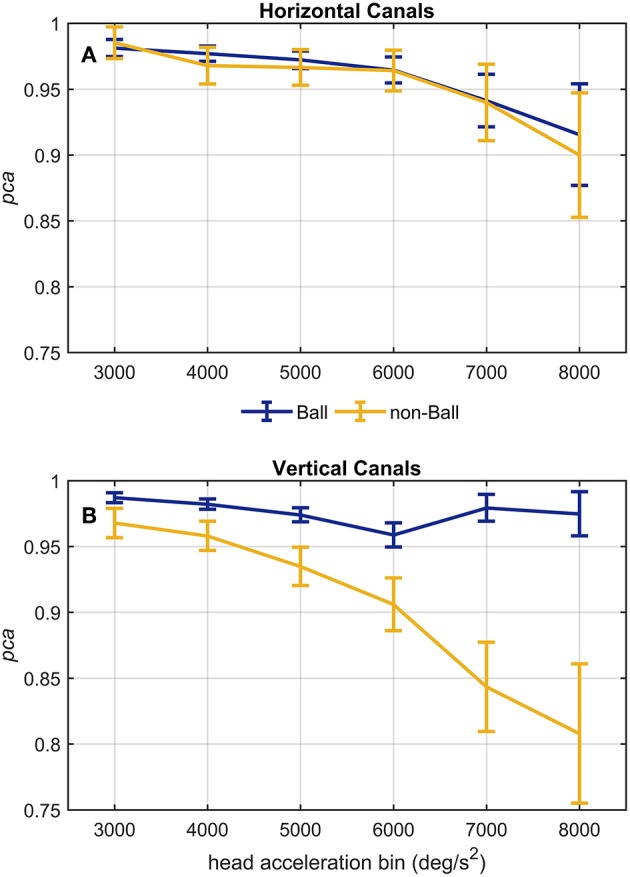
Figure 8.

Proportion of correct answers (pca) of ball and non-ball groups at different head acceleration bins. The error bars represent the pca and 95% confidence intervals estimated for bin of acceleration (3,000–8,000 deg/s2). Pca were computed using the single approach (Equation 1) for impulses performed in the plane ot the horizontal (A) and vertical (B) canals. Confidence intervals for pca were estimated as in Figure 3. Dark blue and yellow lines represent the pca estimated for the ball and non-ball groups, respectively. (A) The relationship between head acceleration and test performance appeared comparable between the two subgroups of athletes (ball and non-balls) for the impulses collected in the plane of the horizontal canals. No significant difference was, indeed, found for every acceleration bin (Table 4A). (B) As visible, the two ball and non-ball subgroups showed two peculiar relationships of head acceleration and pca. The comparisons between the subgroups showed a significant higher pca of the ball group than the non-ball group, irrespective of head acceleration bins (Table 4B).
