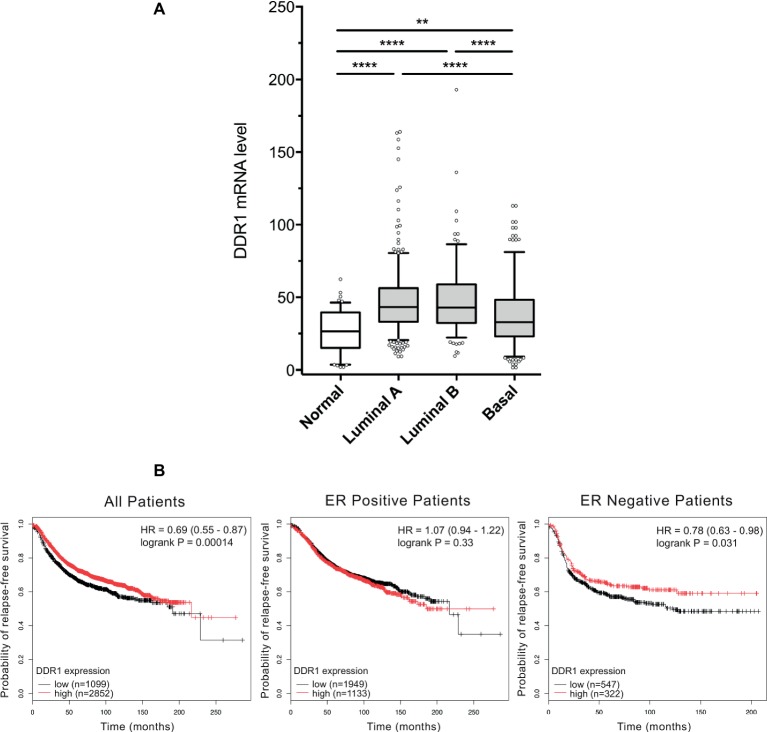
Figure 2.
DDR1 expression in breast cancer and the associated correlation with prognosis in ER negative tumors. (A) Box-and-whisker plots comparing the expression level of DDR1 among normal, luminal A, luminal B, and basal subtypes. Shaded rectangles represent interquartile range; line in the middle of each rectangle represents median value. Lines extending from the interquartile range mark the 5th and 95th percentile values, and the individual open circles represent values that are either above the 95th percentile or below the 5th percentile for each distribution. **, p < 0.01; ****, p < 0.0001. (B) Kaplan–Meier representation of relapse-free survival (RFS) probability over time for breast cancer patients irrespective of the ER status, ER positive and ER negative patients with high or low DDR1 expression.

