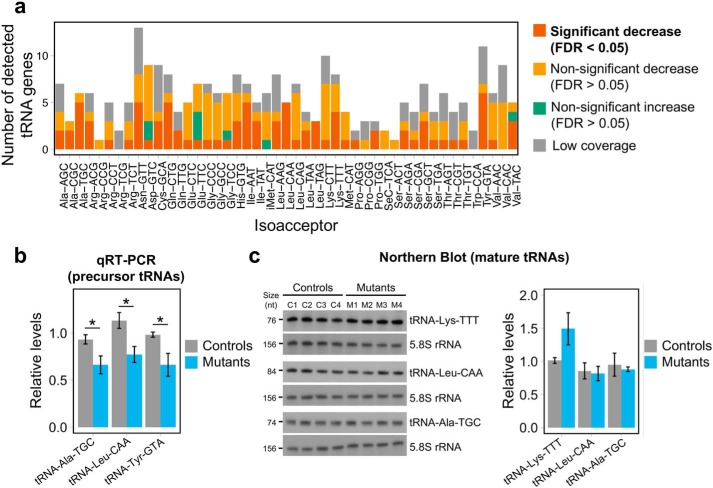
Figure 4.
Global decrease in tRNA levels in POLR3A mutants. a, differential expression results from small RNA-seq for detected tRNA genes, categorized by isoacceptor families, showing that affected tRNAs belong to most families. The threshold for low tRNA coverage was mean normalized expression <10. b, expression of three tRNA genes measured by qRT-PCR in total RNA from three controls (C1–C3) and three mutants (M1–M3). tRNA gene expression was normalized to the stable genes SDHA, PSMB6, and COPS7A using the ΔΔCt method. For tRNA–Leu–CAA and tRNA–Tyr–GTA, primers are specific to the precursor form, and primers for tRNA–Ala–TGC do not discriminate between the precursor and mature forms at the sequence level. Groups were compared using a one-tailed Student's t test. c, left, expression of mature tRNAs measured by Northern blotting in four control (C1–C4) and four POLR3A mutant (M1–M4) HEK293 cell lines. The top blot was sequentially probed with BC200 RNA (Fig. 5c), tRNA–Lys–TTT, and 5.8S rRNA, which was used as a loading control for both figures. The middle and bottom blots were sequentially probed with tRNA–Leu–CAA or tRNA–Ala–TGC and 5.8S rRNA as a loading control. Transcript sizes in nucleotides (nt) are indicated on the left. Right, quantification of the Northern blotting. tRNA levels were normalized by 5.8S rRNA levels. *, p value < 0.05.

