Figure 5.
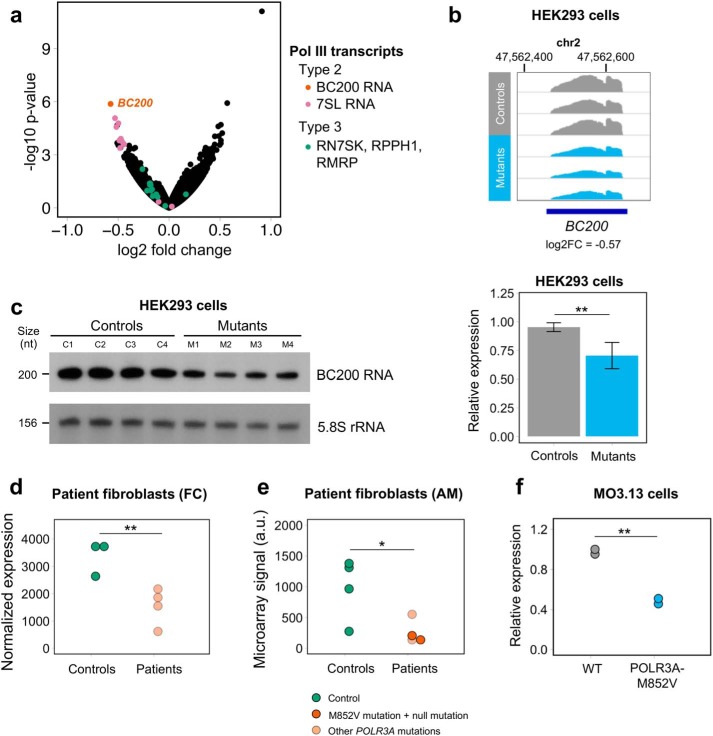
BC200 RNA is the top down-regulated Pol III transcript in multiple datasets of POLR3A mutant cells. a, volcano plot representing the results of differential expression analysis between HEK293 controls and mutants using rRNA-depleted RNA-seq (long RNA transcriptome). Expressed genes and pseudogenes encoding Pol III transcripts are shown in distinct colors based on their promoter type. b, Integrative Genomics Viewer screenshot of normalized BC200 expression in HEK293 controls and mutants. All samples are represented on the same scale (0–2900). c, left, expression of BC200 RNA measured by Northern blotting in four control and four POLR3A mutant HEK293 cell lines. Transcript sizes in nucleotides (nt) are indicated on the left. This blot was sequentially probed with BC200 RNA, tRNA–Lys–TTT (Fig. 4c), and 5.8S rRNA, which was used as a loading control for both figures. Right, quantification of the Northern blotting. BC200 RNA levels were normalized by 5.8S rRNA levels. The two groups were compared with a one-sided Student's t test. d, RNA-seq BC200 RNA normalized expression in primary fibroblasts from controls and French Canadian (FC) POLR3–HLD patients. e, microarray signal for a probe targeting the 3′ unique sequence of BC200 RNA in fibroblasts from controls and American (AM) POLR3–HLD patients. The two carriers of the M852V mutation are shown in darker orange. The two groups were compared with a one-tailed Student's t test. f, expression of BC200 RNA measured by qRT-PCR in the WT and POLR3A mutant MO3.13 cells. BC200 RNA expression was normalized to PMM1 and NDUSF2 using the ΔΔCt method. The two groups were compared with a one-tailed Student's t test. *, p value < 0.05; **, p < 0.01.

