Figure 5.
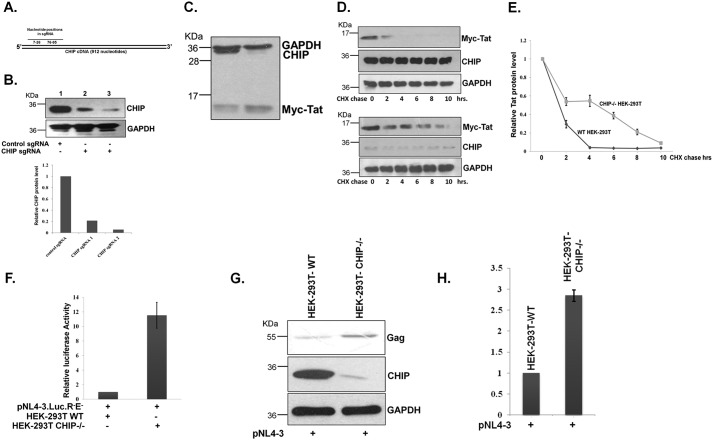
A, diagram showing the position of sgRNA in CHIP cDNA. B, HEK-293T cells were transfected with CHIP sgRNA1- and sgRNA2-expressing pX458 plasmid; after 48 h, the GFP-expressing cells were subjected to FACS. Cells were lysed, and endogenous CHIP level was monitored by immunoblotting. C, Myc-Tat was transfected into WT or CHIP knockdown HEK-293T cells, and after 36 h, Tat protein was detected by immunoblotting. The blot is representative of three different independent experiments. D, both WT and CHIP knockdown HEK-293T cells were transfected with Myc-Tat, and after 24 h, CHX chase was performed, and Tat protein was immunoblotted. The blot is representative of three different independent experiments. E, Tat amount was measured by ImageJ and plotted with reference to CHX treatment time. F, pNL4-3Luc.R−E− was transfected into both WT and CHIP knockdown HEK-293T, and after 36 h the luciferase activity was measured. GFP was also transfected as a transfection control, and the graph was plotted after normalization of luciferase readings with GFP fluorescence. G, pNL4-3 was transfected both into WT and CHIP knockdown HEK-293T, and after 36 h of post-transfection, Gag was immunoblotted. The blot is representative of three different independent experiments. H, Gag protein level was measured with ImageJ and plotted.

