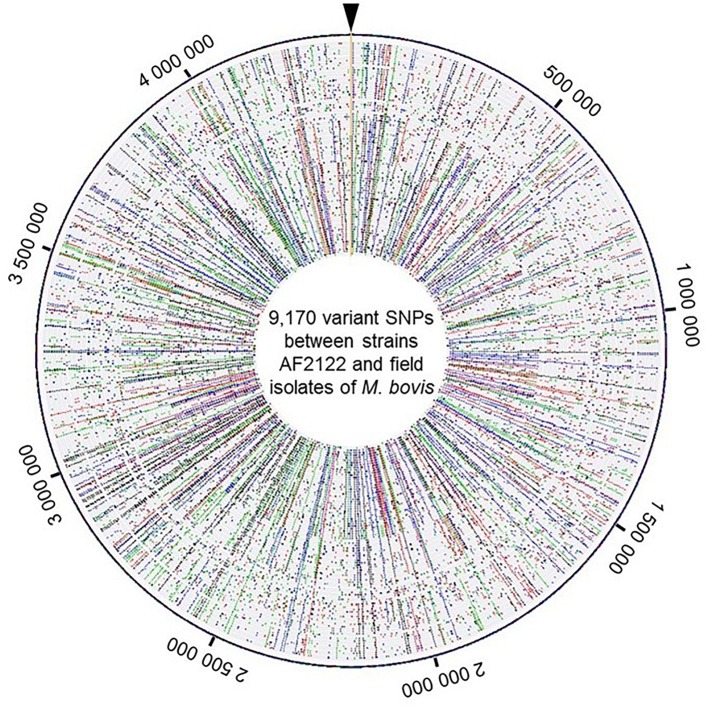
FIGURE 2.
View of the genome wide distribution of the 9,170 variant SNPs identified between the strains AF2122/97 and the 87 field isolates of M. bovis. Maps were generated using Bionumerics software. Each circle corresponds to one strain genome. The field isolate genomes were arranged by genotype group from the reference genome depicted at the outer circle. Around the outer circle are indicated the genome positions (base pair). The base changes are shown in different colors: A in green, C in blue, G in black, and T in red.

