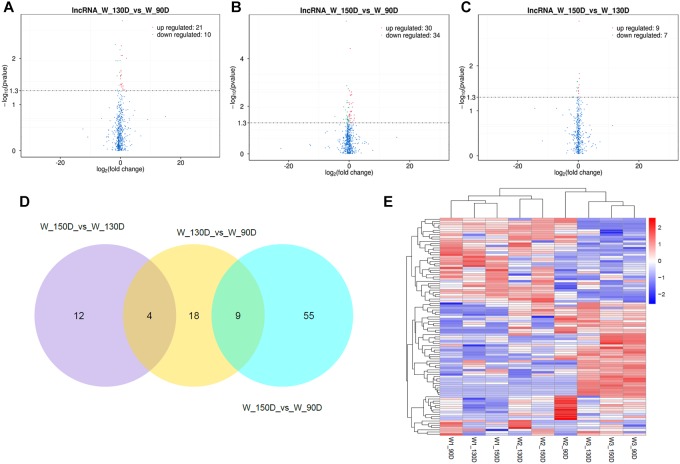
FIGURE 2.
Changes in lncRNA expression during the Angora rabbit hair follicle cycle. (A–C) Volcano plots showing up- and down-regulated lncRNAs between days 90, 130, and 150 of the hair follicle cycle. (D) Venn diagram showing the number of overlapping differentially expressed lncRNAs between days 90, 130, and 150. (E) Heat map of lncRNAs showing hierarchical clustering of DE lncRNAs between days 90, 130, and 150. Up- and down-regulated lncRNAs are shown in red and blue, respectively.

