
Fig. 2.
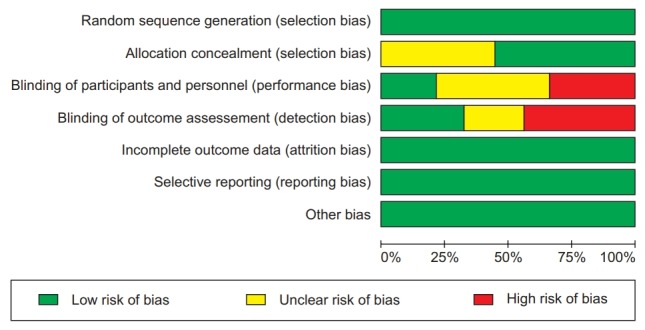
Risk of bias graph illustrating the proportion of studies with each judgement (‘Yes’, ‘No’, or ‘Unclear’) for each entry in the tool.
Official websites use .gov
A
.gov website belongs to an official
government organization in the United States.
Secure .gov websites use HTTPS
A lock (
) or https:// means you've safely
connected to the .gov website. Share sensitive
information only on official, secure websites.
Risk of bias graph illustrating the proportion of studies with each judgement (‘Yes’, ‘No’, or ‘Unclear’) for each entry in the tool.