
Fig. 3.
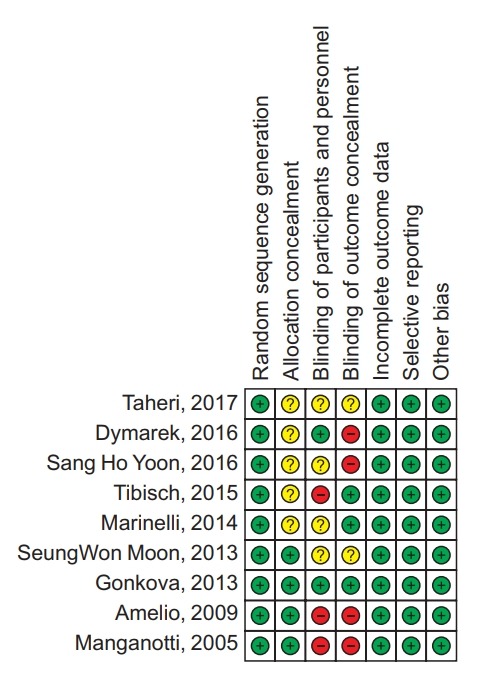
Risk of bias summary. It presented all judgements in a cross-tabulation of study by entry of + (Yes), – (No), and ? (Unclear).
Official websites use .gov
A
.gov website belongs to an official
government organization in the United States.
Secure .gov websites use HTTPS
A lock (
) or https:// means you've safely
connected to the .gov website. Share sensitive
information only on official, secure websites.
Risk of bias summary. It presented all judgements in a cross-tabulation of study by entry of + (Yes), – (No), and ? (Unclear).