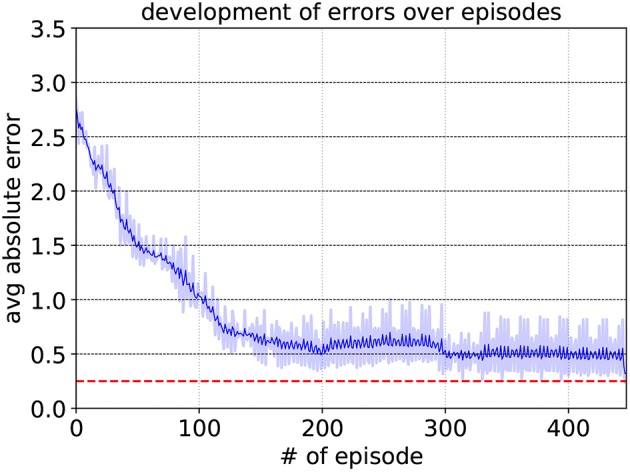
Figure 8.

Development of the target neuron's average deviation from yth,TN for A+ = 0.1, A− = 0.105, ηmax = 0.2, and ηmin = 0.05. The dashed red line represents the maximum deviation of 0.25 that had to be surpassed. The shaded region indicates the average absolute error of each episode. To show the variation trend in a clear way, the solid blue line means the moving mean value of the averaged absolute error over the episode.
