
FIGURE 1.
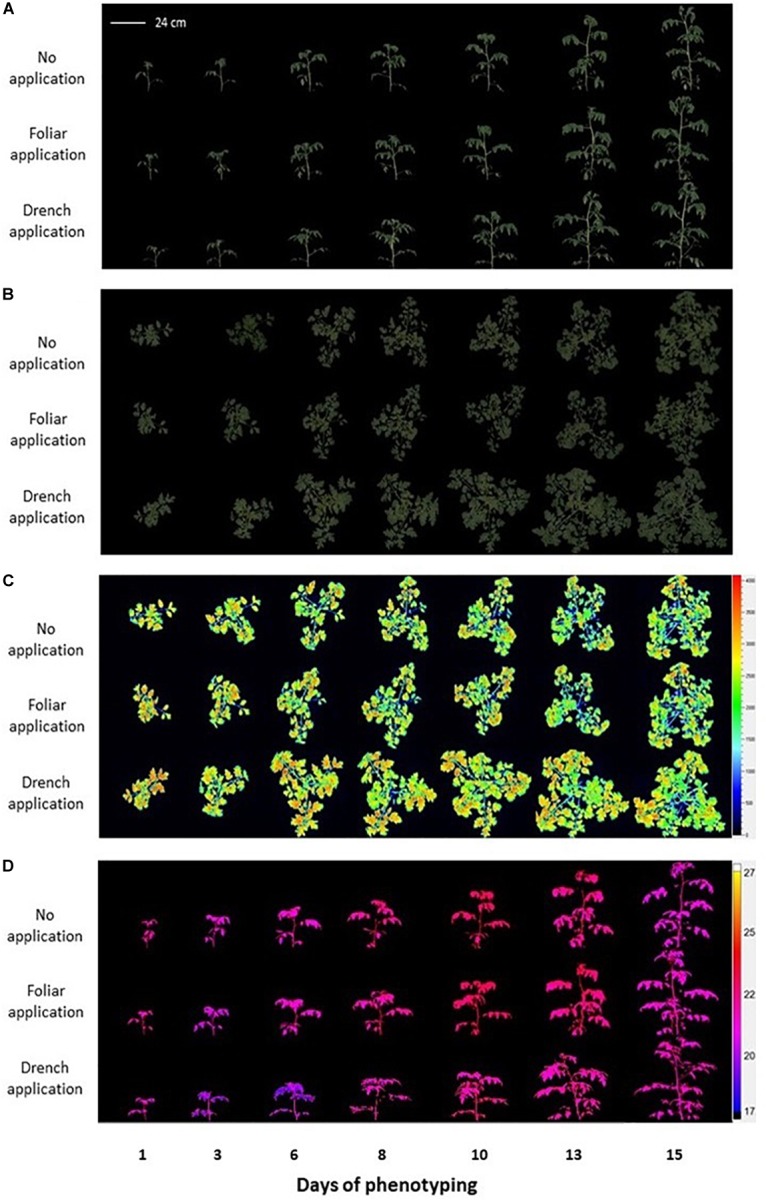
Non-invasive image-based phenotypical analysis of protein hydrolysate treated and control tomato plants grown under water-limiting conditions by using the PlantScreenTM Modular System. (A) Color-segmented side view Red Green Blue (RGB) images of the tomato plants over the time of phenotyping period (D1–D15). (B) Color-segmented top view RGB images of the tomato plants. (C) False-color images of maximum fluorescence value (Fm) of tomato plants captured by kinetic chlorophyll fluorescence imaging. (D) False-color side view images of plant leaf surface temperature captured by thermal camera.