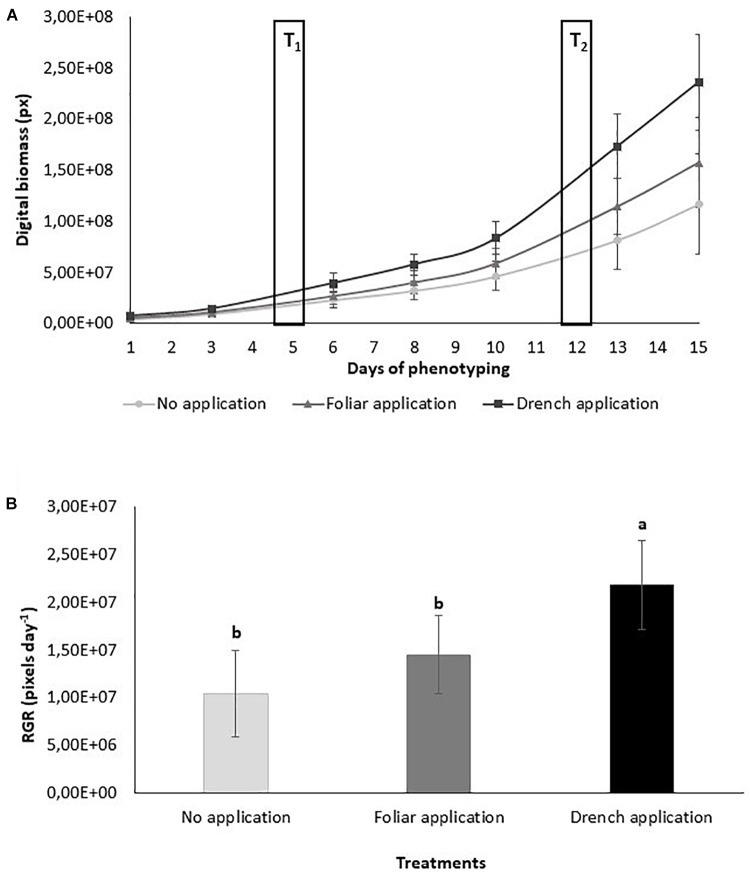
FIGURE 2.
Growth performance of protein hydrolysate treated and control tomato plants. (A) Digital biomass quantified over time of phenotyping period. Values represent the average of six biological replicates per treatment. Error bars represent standard deviation. T1 and T2 correspond to days of protein hydrolysate application by foliar spraying or substrate drench. (B) Comparison of relative growth rate for the different treatments quantified over phenotyping period following the protein hydrolysate treatments. Values represent the average of six biological replicates per treatment. Error bars represent standard deviation. Different letters indicate significant difference according to one-way ANOVA post hoc Tukey’s test (p < 0.05).

