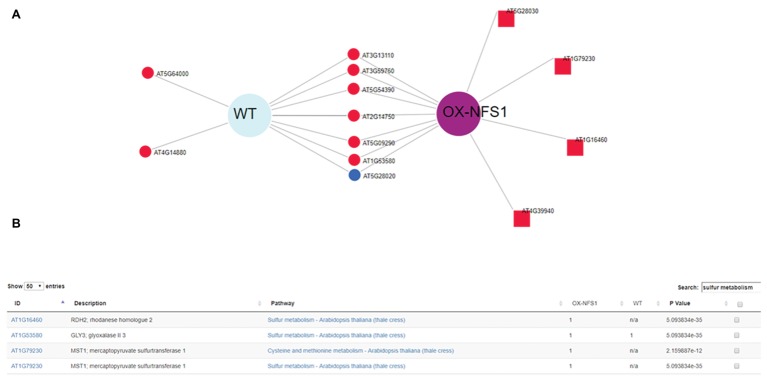
Figure 4.
DiVenn subset analysis of genes obtained using redraw function from KEGG pathway analysis search “sulfur metabolism” showing 14 DE genes up and downregulated from OX-NFS1 and WT. (A) Genes upregulated only for OX-NFS1 are highlighted as square nodes via the redraw function. (B) Table consisting of genes from subset graphic KEGG pathway search “sulfur metabolite” displaying DE genes between the two genotypes OX-NFS1 and WT (just first four rows out of 14) and pathway p’s. The numbers 1 and 2 refer to upregulated and downregulated genes, respectively, for each Arabidopsis gene accession number.

