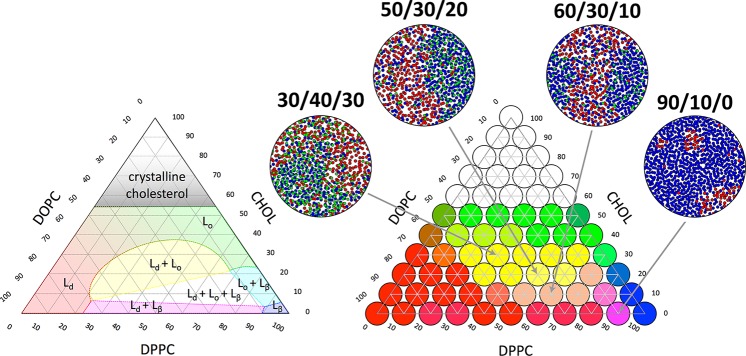
Figure 3.
Example of a multicomponent membrane phase diagram. The ternary lipid mixture dioleoyl phosphocholine (DOPC), DPPC, and cholesterol exhibits a range of interesting phase behavior. Experimental phase diagram is shown on the left, and a simulated diagram using further optimized Martini parameters for DOPC and DPPC on the right. Inserts show snapshots of four of the different simulations illustrating the phase separation. The lipids are colored red, blue, and green for DOPC, DPPC, and cholesterol, respectivly. Adapted from ref (335). Copyright 2018 American Chemical Society.

