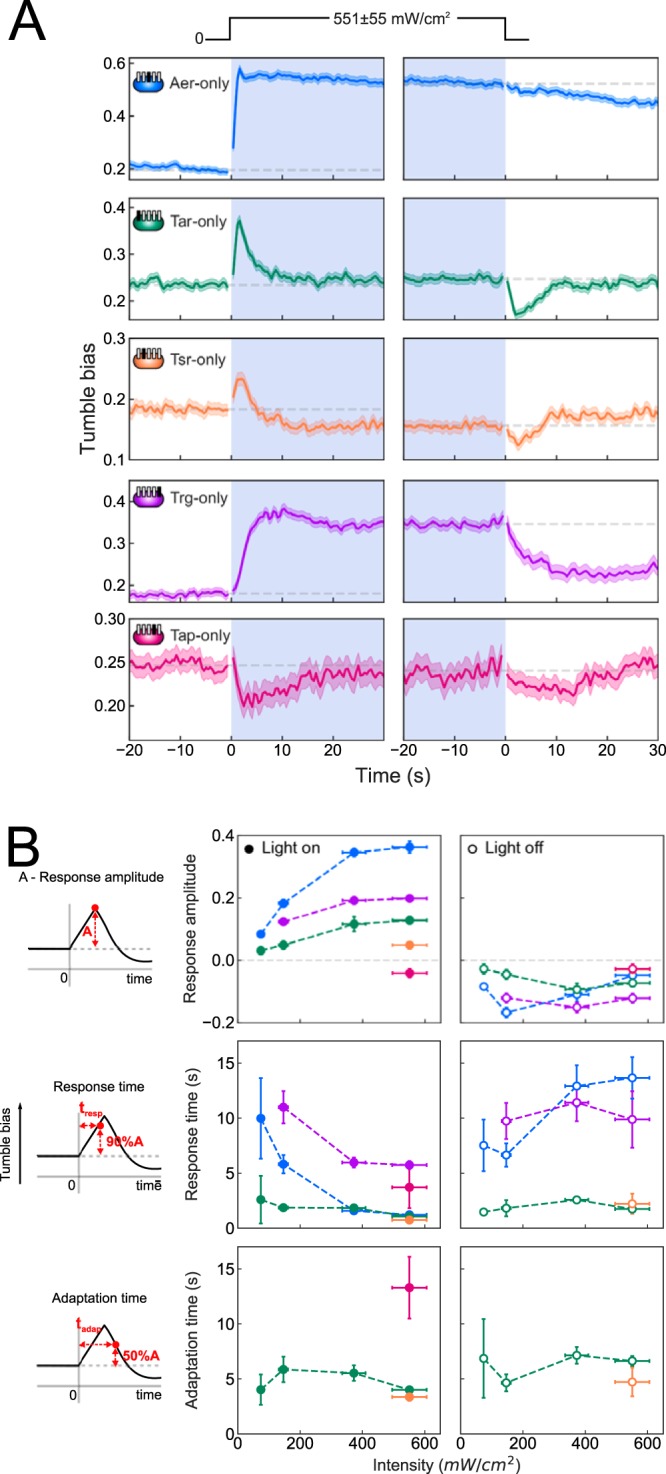
FIG 2.

Blue light responses for single-receptor E. coli strains. (A) Tumble bias traces for single-receptor E. coli strains (Table 1), i.e., Aer-only (blue), Tar-only (green), Tsr-only (orange), Trg-only (purple), and Tap-only (magenta) strains. Approximately 200 to 2,000 trajectories were used to calculate the average tumble bias at each time point. Schematics indicate which receptors are present (filled rectangles) or absent (empty rectangles) in each strain. All responses were measured at a blue light intensity of 551 ± 55 mW/cm2, as indicated by the light intensity profile. Gray dashed lines show the prestimulus tumble bias for turn-on and turn-off responses. (B) Blue light intensity dependence of parameters for the responses to turn on (filled circles) and turn off (empty circles) for all strains. Response amplitude, response time, and adaptation time were calculated as illustrated by the schematics.
